Fruits of Vatican II
I
Observational Analysis of the Male Religious Memberships
A Willful Ignorance of an Ongoing Catastrophe?
Jack P. Oostveen & David Sonnier
|
In his opening address Pope St. John XXIII had set the substantive rules for the Second Vatican Council itself as well as for its interpretation, which is not only a kind of continuity with, but more explicit in unity and accordance to the Doctrine as taught by the Fathers. They may "never depart from the sacred patrimony of truth received from the Fathers" and "the sacred deposit of Christian doctrine should be guarded and taught more efficaciously" -*-*-*- Pope Blessed Paul VI gave a clear description and condemnation of the hermeneutic of discontinuity and rupture in his address to the Cardinals of the Curia on June 23, 1972 "... an emergency which We cannot and must not keep hidden: in the first place a false and erroneous interpretation of the Council, which would want to break with tradition, even as regards doctrine, an interpretation which goes so far that the pre-conciliar Church is rejected and one is allowed to consider a 'new' church, as it were reinvented from the inside, as regards the constitution of the Church, her dogma, custom and law" |
"By their fruits you will know them" (Matt. 7, 15-16)
CONTENT
 1 Introduction
2 Background
3 General Observations
4 Methodology
4.1 Institutes Grouped According to Characteristic Timelines
4.1.1 Category 1: Institutes in Severe Decline
4.1.2 Category 2: Institutes in Decline but Eventually Finding Stability
4.1.3 Category 3: Institutes in Decline but Eventually Reaching a Slow Rate of Growth
4.1.4 Category 4: Institutes Eventually Restoring Pre-1965 Membership Level
4.1.5 Category 5: Institutes Eventually Restoring Pre-1965 Rate of Growth
4.1.6 Category 6: Institutes suffering no post-1965 Decline
4.1.7 Category 7: Institutes founded after 1966
5 Analysis
5.1 Period from 1950 to 1976
5.2 Period From 1976 to 2014
6 Conclusion
List of Figures
References
Appendix II, Simulation/Extrapolation
A summary of this report has been published
here on 1P5 and
here on Christendom Restoration Society
This report can be downloaded as pdf-file in A5 format here or A5-booklet format here.
send an Email
return
1. Introduction
The subject of the vocations crisis in the Catholic Church, post Vatican II, has been addressed many times in printed and electronic media, academia, and within ecclesiastical circles. Often those addressing the question do so to advance agendas that are not compatible with Catholic doctrine. We confine our discussion to the point of view in which Catholics are seeking a solution within the context of the teachings of the Catholic Church. This analysis has two stages of which the first is reported here. This first stage is an observational analysis of the development of Institutes of Consecrated and Societies of Apostolic Life for male religious from 1950 to the present, according to data available in the public domain.
<4font color="blue">"By their fruits you will know them"
The second part (here)will provide a more substantive analysis of the processes behind the observations that are being made in this first part.
Now that it has been over fifty years since the conclusion of the Second Vatican Council, we can see that some religious groups are surviving while others are stagnant or dying. Some inspire new vocations, resulting in an increase of the number of religious, while others lack such ability to inspire and are suffering a lack of vocations. The latter situation leads to a continual process of aging and declining membership that can ultimately be terminal. What steps can be taken to prevent such religious groups from dying out altogether? The authors assert that internal measures can be taken to strengthen the spiritual quality of these institutes. Observing the rates of vocations of religious groups can indicate the need for such measures. Genuine vocations that potentially seem to be "lost" to one religious group will often find a way into another religious group or even take part in a newly founded group. Herein we seek common traits among various religious groups by categorizing them according to "timelines" from 1950 to the present. By grouping them among others with similar characteristic timelines, we can seek common threads among those which are thriving and those which are heading toward possible extinction.
2. Background
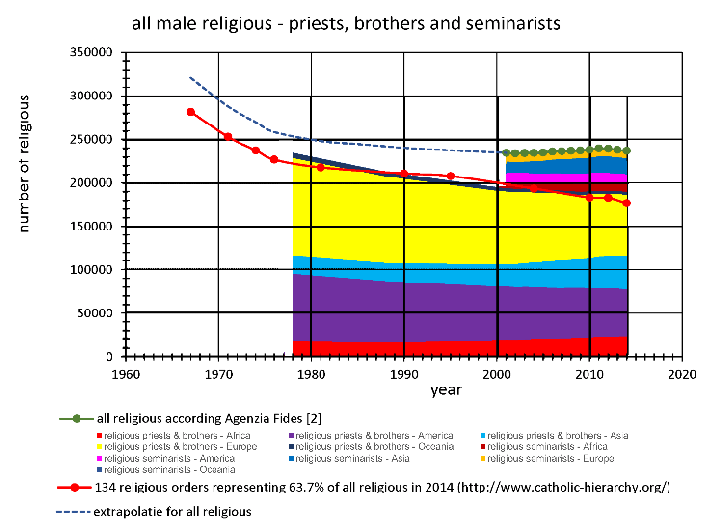
| Figure 1: Male religious (1978 - 2000 (EWTN [4]) and 2001 - 2014 (Agenzia Fides [3]) |
![Figure 1: Male religious 1978 - 2000 (EWTN [4]) and 2001 - 2014 (Agenzia Fides [3])](http://www.ecclesiadei.nl/plaatjes/fruits_1/image003.png)
|
Other databases available in the public domain, such as Agenzia Fides [3] (additionally by EWTN [4]), GCatholic.org (formerly Giga-Catholic Information) [5] and CARA [6], are restricted in the terms of sampling periods and/or geographic location.
Among these databases, Agenzia Fides provides the total number of all religious for the period from 2001 to 2014 (Figure 1) and thereto additional to 'The Hierarchy of the Catholic Church'. The Agenzia Fides does not distinguish the several religious congregations, but it sets an interesting distinction among various regions of the world for the period from 2001 to 2014.
Kenneth Jones provides some statistics and analysis pertaining to the situation in the US Church in Index of Leading Catholic Indicators [7].
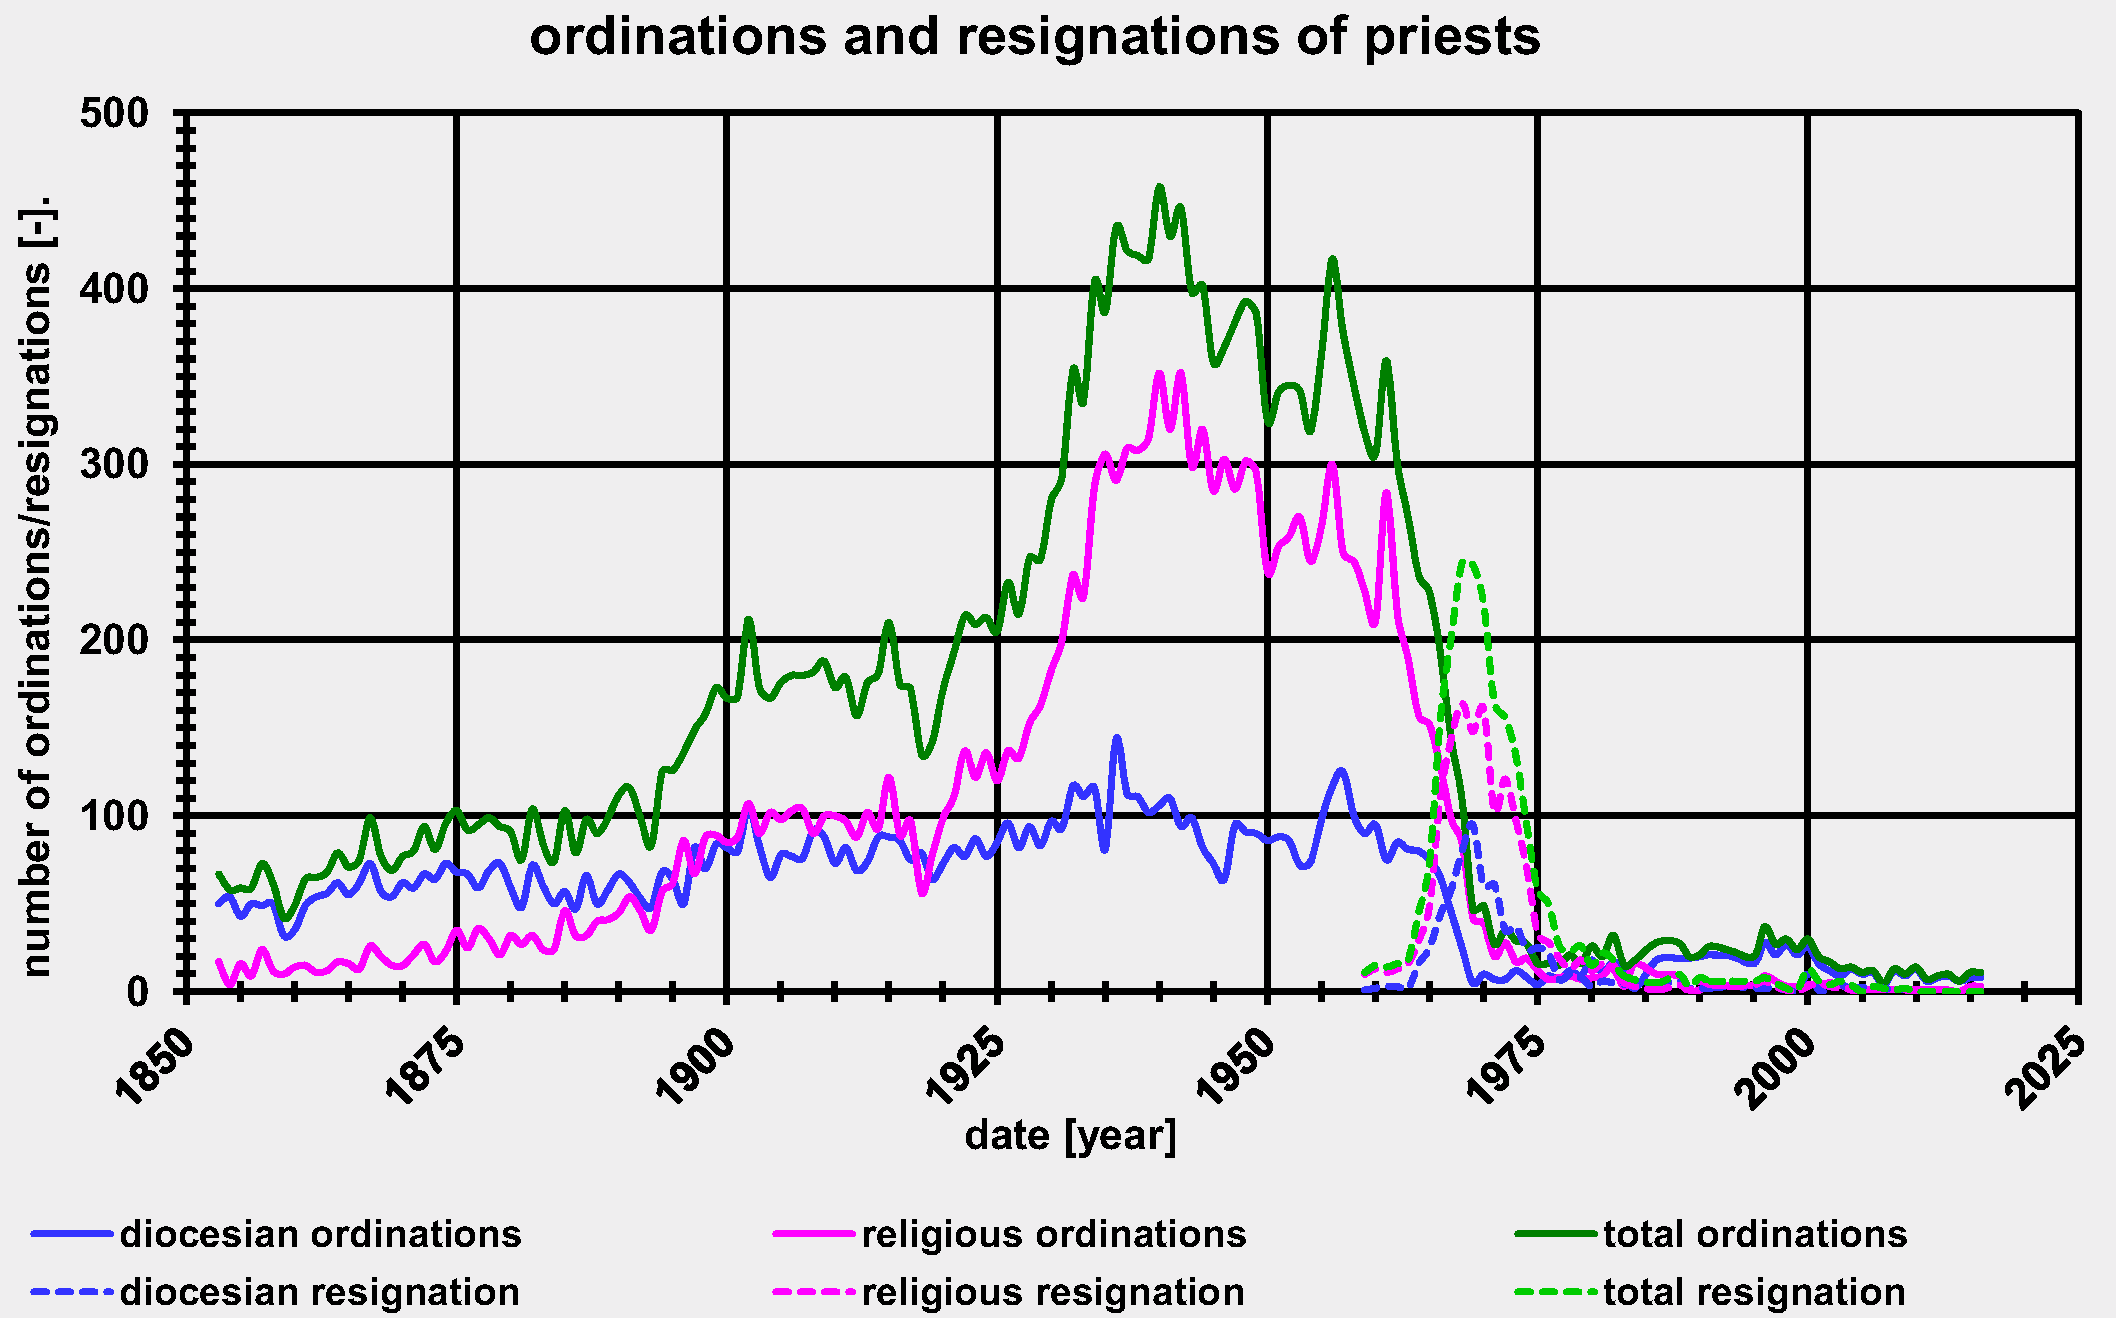
One of the first systematic analysis of the sudden and precipitous decline of the clerical population dealt specifically with the Netherlands [8], [9]. The beginning of a dramatic decline of ordinations became visible about 1963 for religious and 1965 for the diocesan priests while an exceptional increase of resignations can be observed between 1964 and 1976 with a maximum at 1970 for both religious and diocesan priests.
Through this simple example we can understand the seriousness of the situation, depicted in Figure 2 to Figure 5. Though the Netherlands was neutral during World War I (1912-1918) and therefore not directly involved in this war, the steady growth of vocations was partly interrupted by this war and its aftermath, then again by World War II (1940-1945) and the aftermath and after that there is a visible post-war recovery (Figure 2). But throughout this period (1853 to the present) of the Catholic Church in the Netherlands, there is nothing quite as dramatic as the decline that begins in 1963. In other words, the damage caused by World Wars I and II was negligible compared to the devastation beginning with and following the Second Vatican Council.
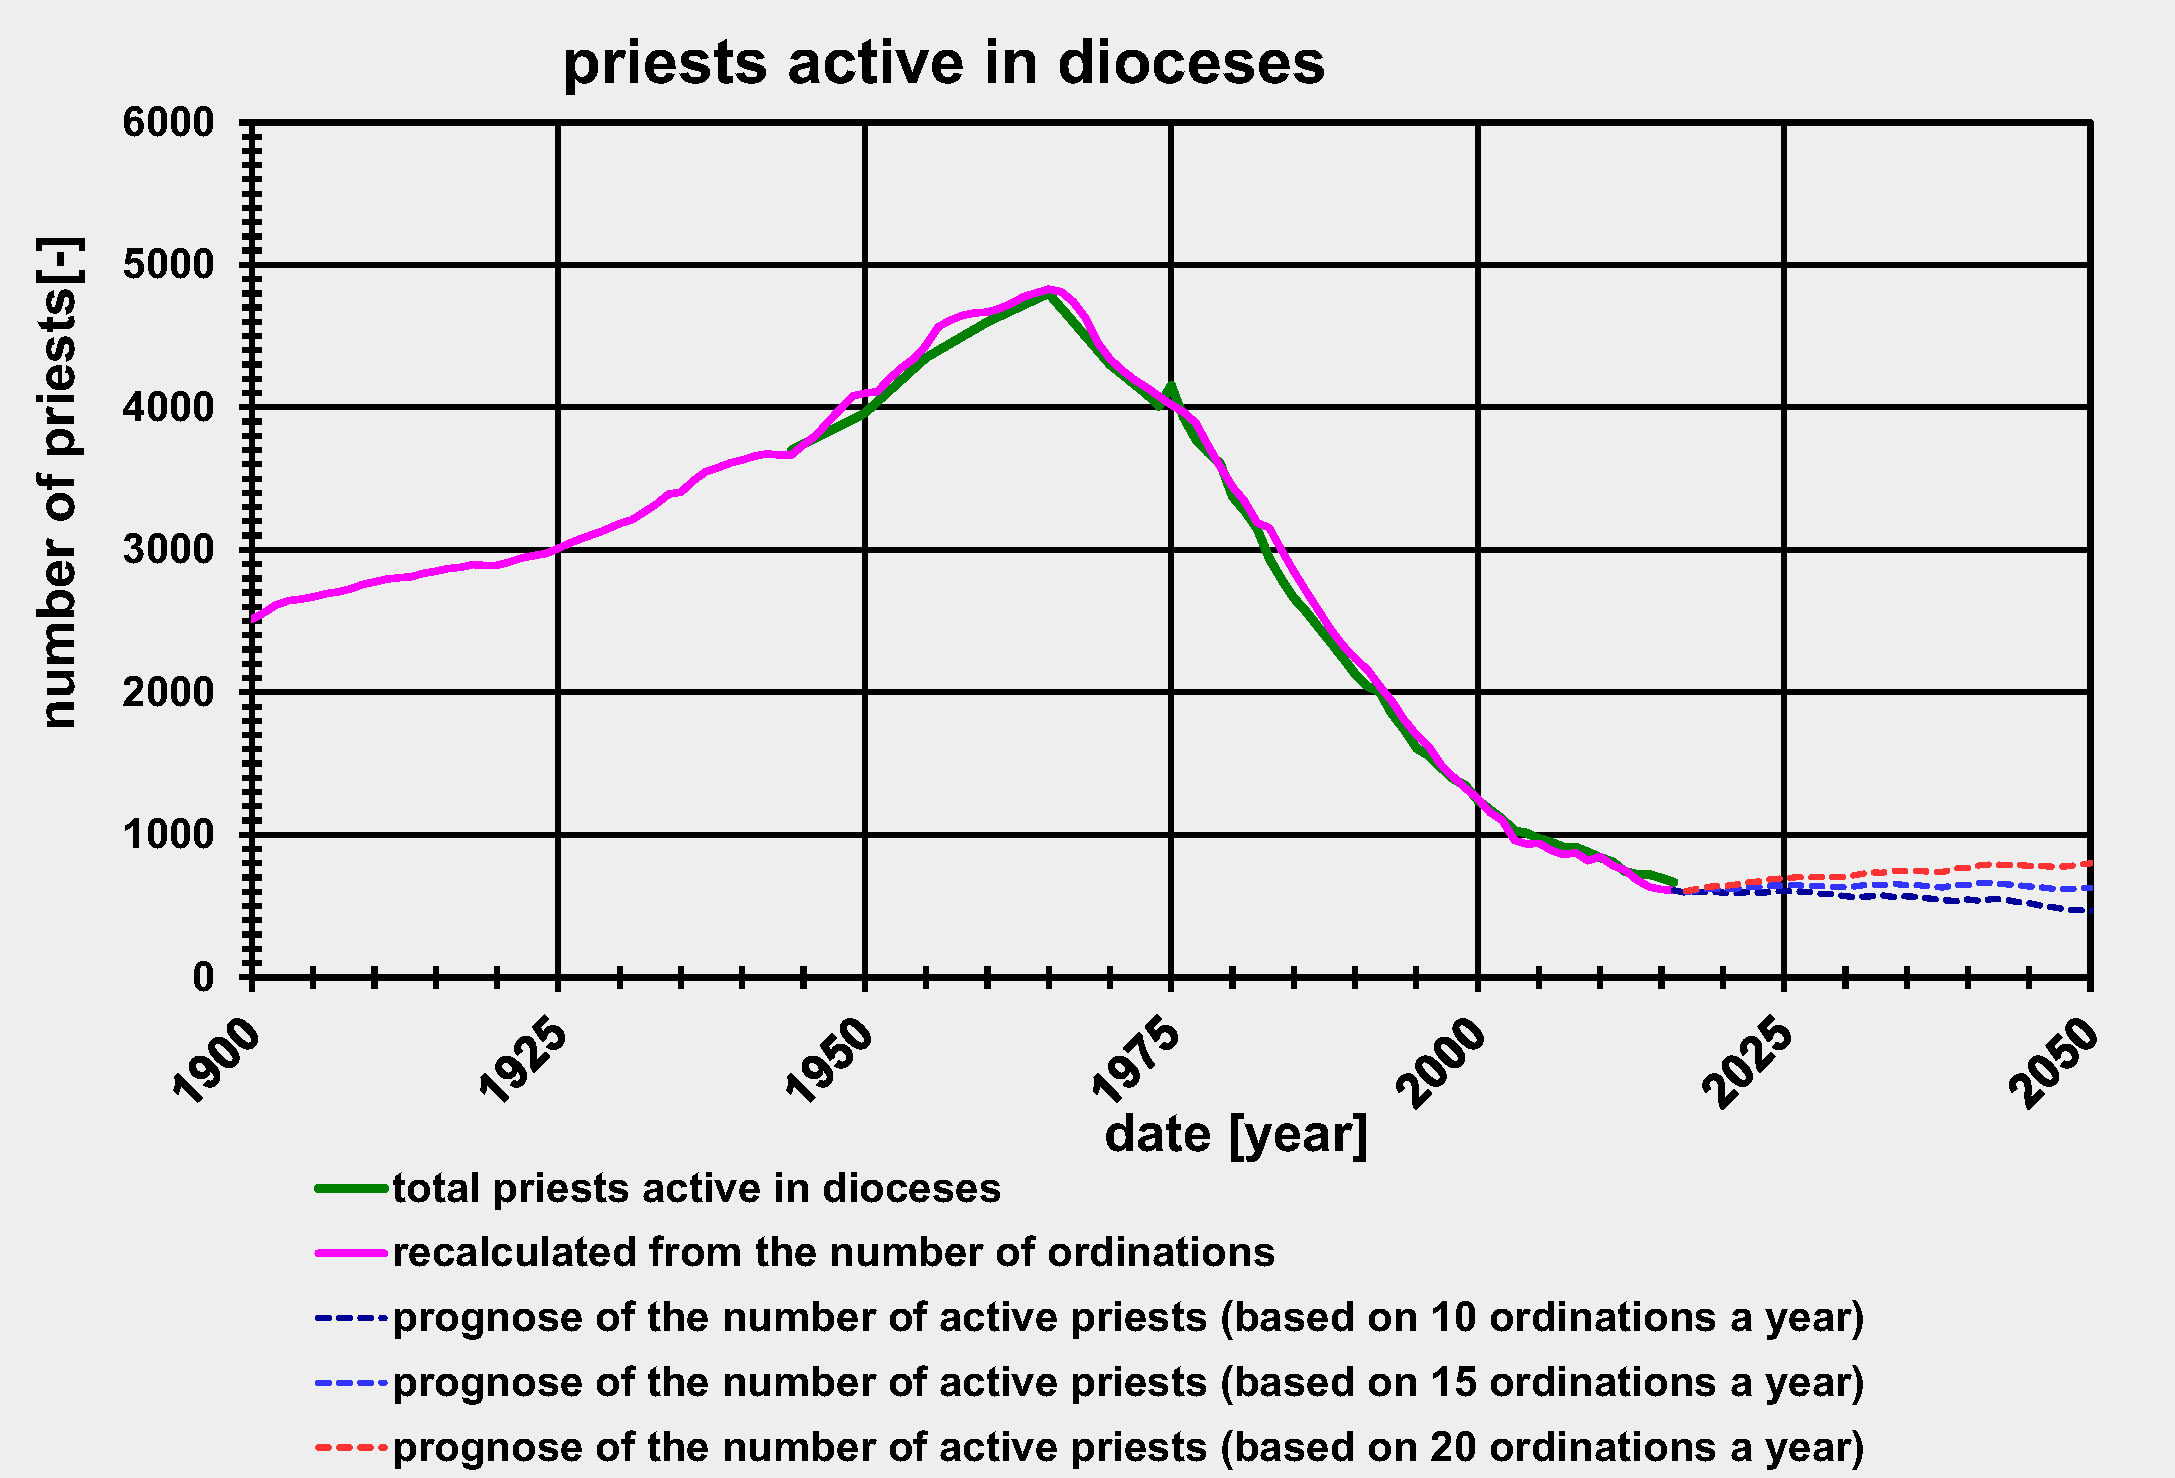
Also note that it is during this post 1963 era that, in addition to the sudden high dropout rate of the seminarians, we begin to see mass resignations from the priesthood. All of this results in a serious decline in the number of priests who were active in the Dutch dioceses (Figure 3). Comparing Figure 2 with Figure 3, we can see that the decline of the number of priests must be considered as a secondary effect of the dramatic decline of ordinations.
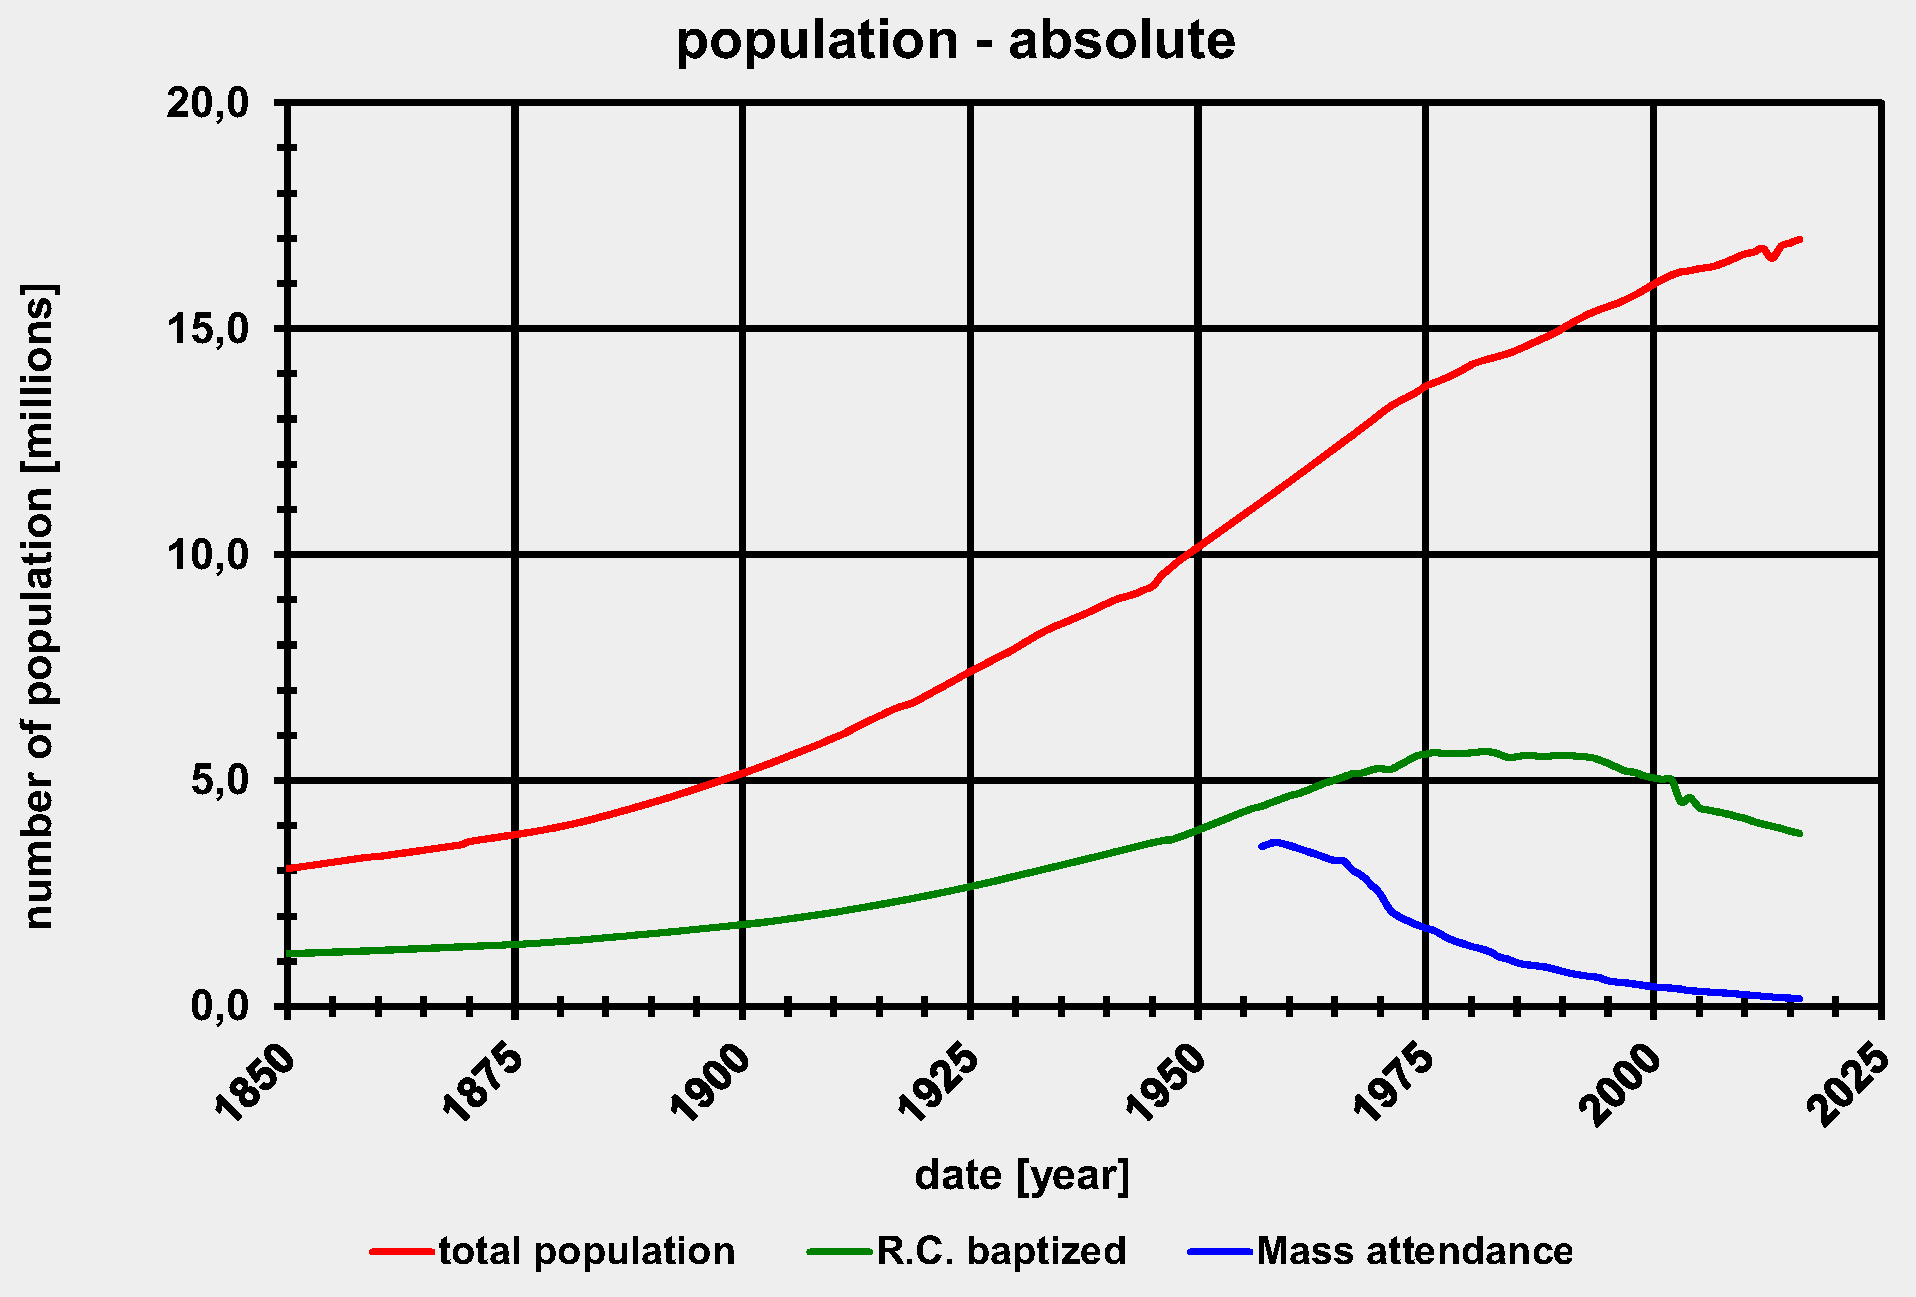
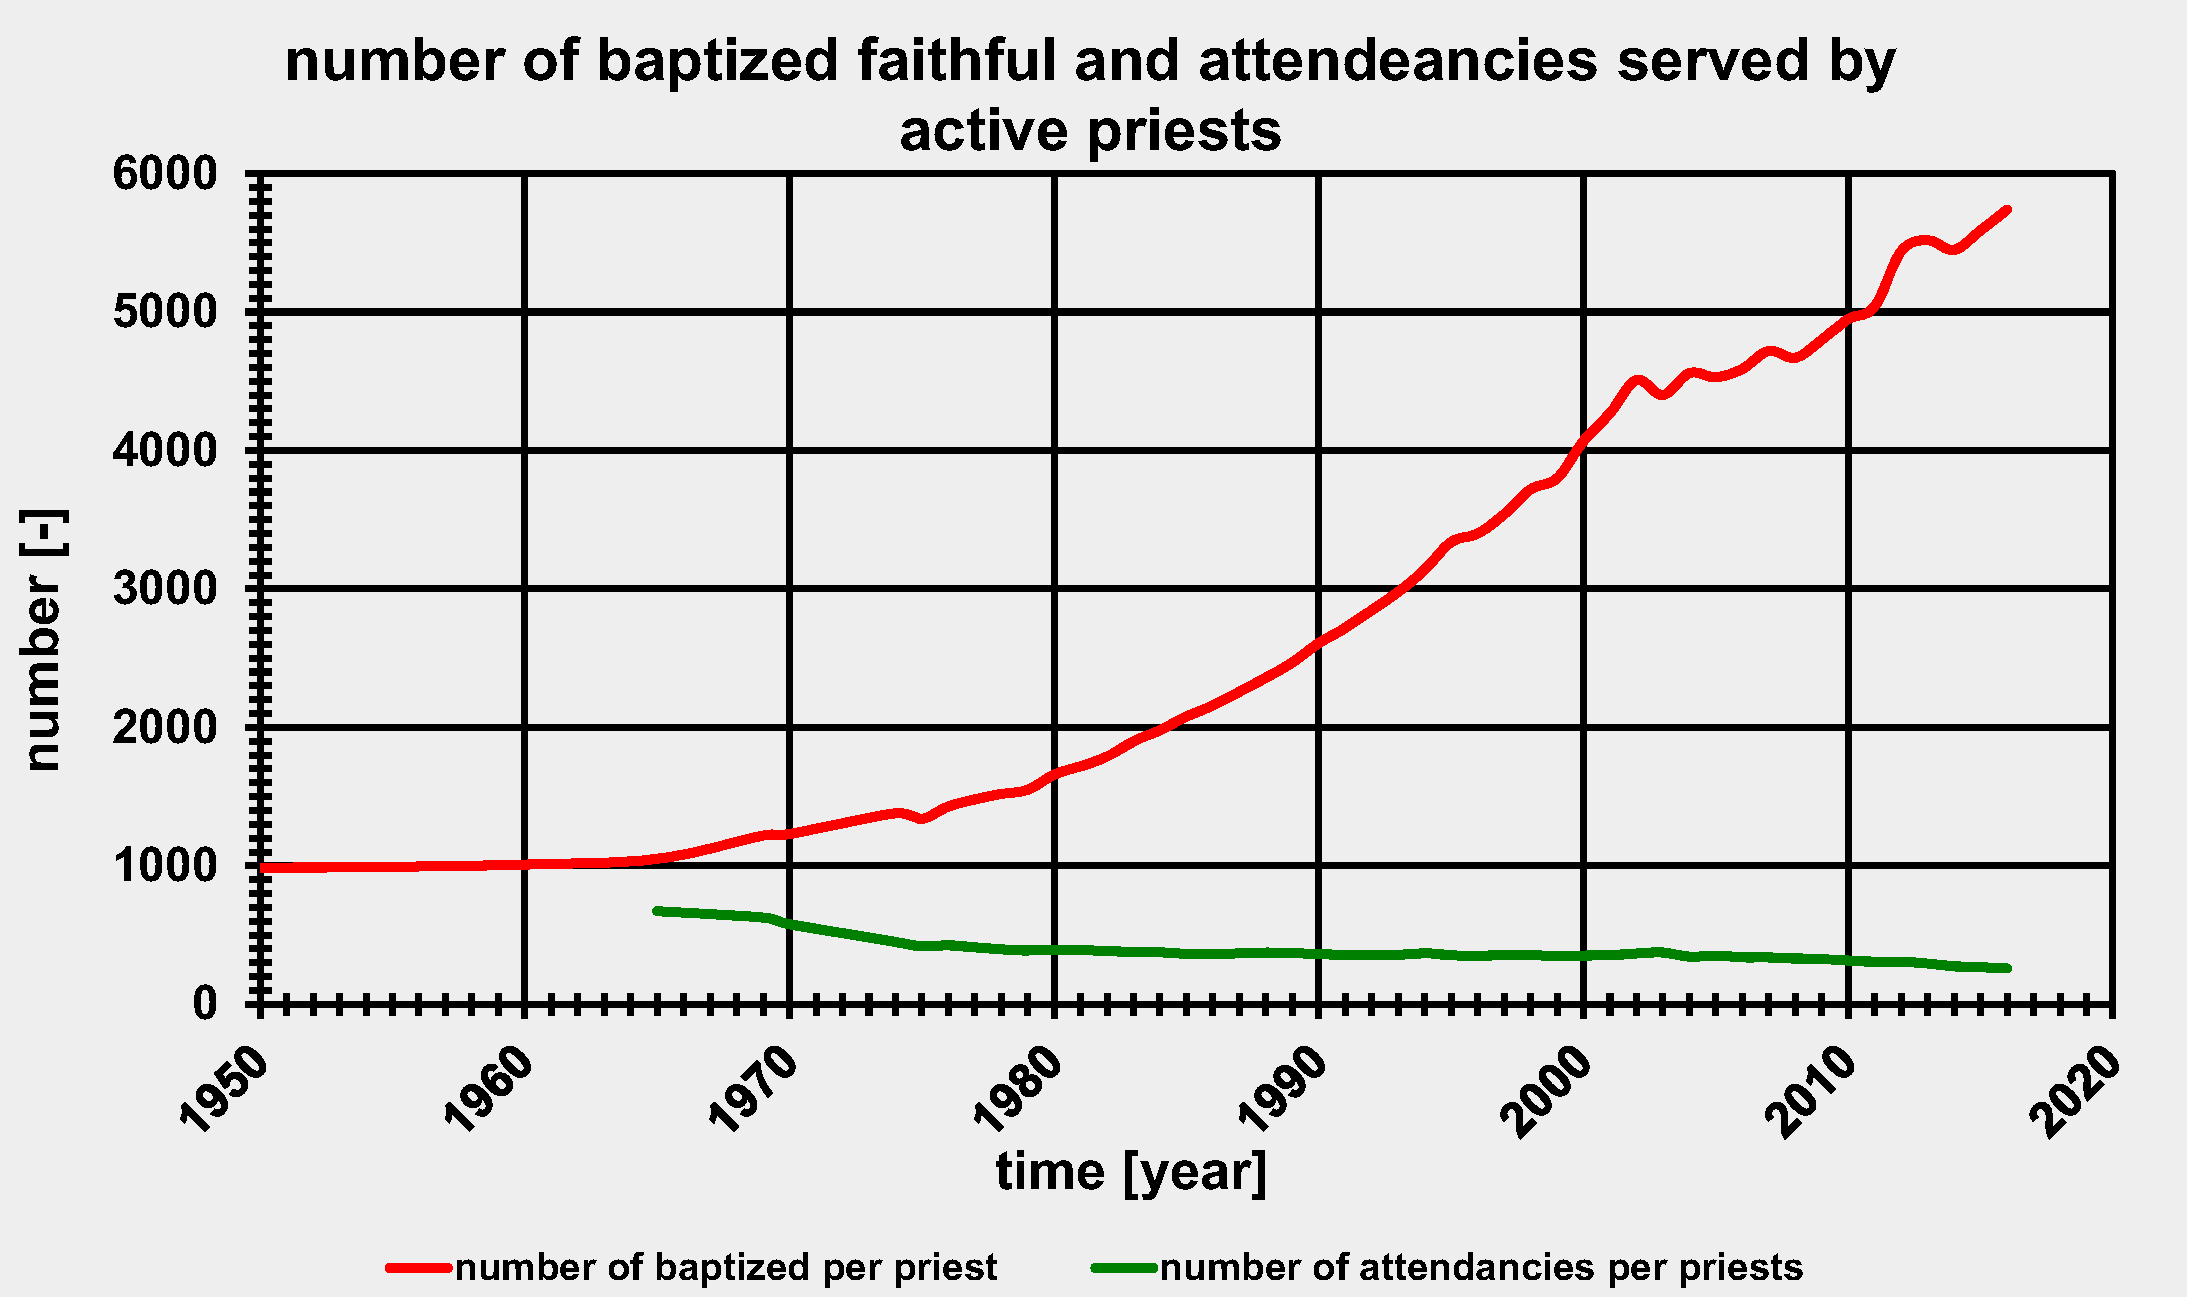
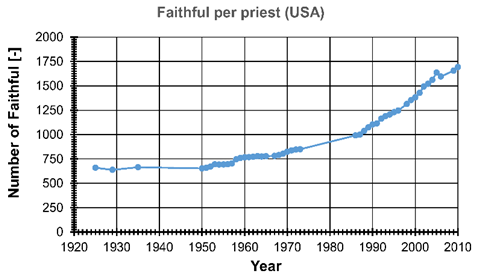
In the same way it can be observed in Figure 4 that the number of baptized faithful was still increasing till the second half of the nineteenseventies. Serious decline did not begin until the nineties. While the development of the total number of baptized faithful has to be considered as a tertiary effect, we can see a manifest decline in Mass attendance already in the second half of the sixties. The acceleration of this decline during the seventies has to be considered as a secondary effect due to the lack of young people. Figure 5 shows these effects on the proportionality between the numbers of faithful per priest by comparing the total number of baptized faithful with that of practicing faithful, whereas the stable 1000 baptized faithful per priest before 1965 has been followed by a rather stable number of 300 practising faithful per priest in the present time.
With regard to these statistics of The Netherland, Father Yves Congard O.P. mentioned in "My Journal of the Council" a conversation with Father Edward Schillebeeckx O.P.: "Schillebeeckx told me that there is a schism, well and truly, in Holland:latent but nevertheless real. Cardinal Alfrink was optimistic in his press conference, He had to be, in order to cut short the accusations of the Italian press. But this does not stop the situation from being worrying" (October 22, 1965).
Subsequent analysis specifically correlating the decline to the state of the liturgy can be found at [10], [11] and [12], but confining the discussion to within the Catholic Church in the USA.
Similarly, in France, a correlation has been made between the growth or decline of the religious institutes by the way they manifest themselves as religious especially the way they are recognisable by their dressing as religious [13]. General discussion of the problem can be found at [14], [15] and [16]. The "Risk analysis of Vatican II" [17] provides a comprehensive study dealing with the issue on a broader scale, throughout the universal Church, and provides an in-depth and systematic analysis of causes, agents, and consequences.
Obviously, one may separate out regions and find differing trends. Currently, as shown by Figure 1 from the dataset of Agenzia Fides, Africa and Asia show an increase in religious vocations [18]. In this figure, we can see that the growth of the number of religious in Africa and Asia is worldwide compensating somewhat for the decline in Europe and America (North, Central and South). Regarding the growth of the number of religious in Asia it has to be said that such growth was true for India until recently [19].
Both authors assert that the liturgical crisis sets the stage for the doctrinal crisis through the maxim of Lex Orandi, Lex Credendi (the law of prayer determines the law of Faith). This timeless principle states that it is the mode of prayer which leads to the seriousness of Faith. The opposite, Lex Credendi, Lex Orandi (the law of Faith determines the law of prayer) according to which the seriousness of Faith determines the way of prayer, also holds true. Accordingly, then, weakening of prayer will be followed by a weakening of the seriousness of Faith. If not corrected, then, this weakened Faith seeks a further weakening of prayer in a process that leads to a vicious spiral that can result in an eventual loss of Faith. On the other hand, the strengthening of our prayers results in an increase in the seriousness of Faith. Liturgy governs Faith; this ancient principle is enshrined in the Catholic Catechism and has been held since the earliest days of Christianity and is the primary notion on which this work is founded.
General spiritual qualities that influence the vitality of religious institutes and societies can be categorized as:
- Teaching and preaching in accordance to the Depositum Fidei (Deposit of Faith);
- Living one's religious life as inspired by the Depositum Fidei;
- The state of the liturgy within the religious institute;
- The associations of faithful from which vocations are taken.
The first category involves the fundamental way in which the full Faith has to be accepted as the law for any expression of Religious Life. The second one concerns the genuine expression of the Religious Life inspired by the Holy Spirit at its foundation. If this expression came from the Holy Spirit, it cannot then be rejected later as being inauthentic. The third category involves in a fundamental way the manner in which the Holy Mass is celebrated and daily prayers are offered as true expressions of the Depositum Fidei within the religious institutes and societies in accordance with the principle Lex Credendi, Lex Orandi. The fourth category concerns the ability of religious congregations to attract vocations, according to their fulfilment of the aforementioned three categories.
Despite the fact that everyone can observe the
lack of vocations and the decline in Mass attendance since Vatican II, Church
leaders and theologians still speak about the 'Fruits of Vatican II'.
This
leads us to ask whether they are guilty a 'Willful Ignorance of an Ongoing Catastrophe'?
This leads us to ask whether they are guilty a 'Willful Ignorance of an Ongoing Catastrophe'?
3. General Observations
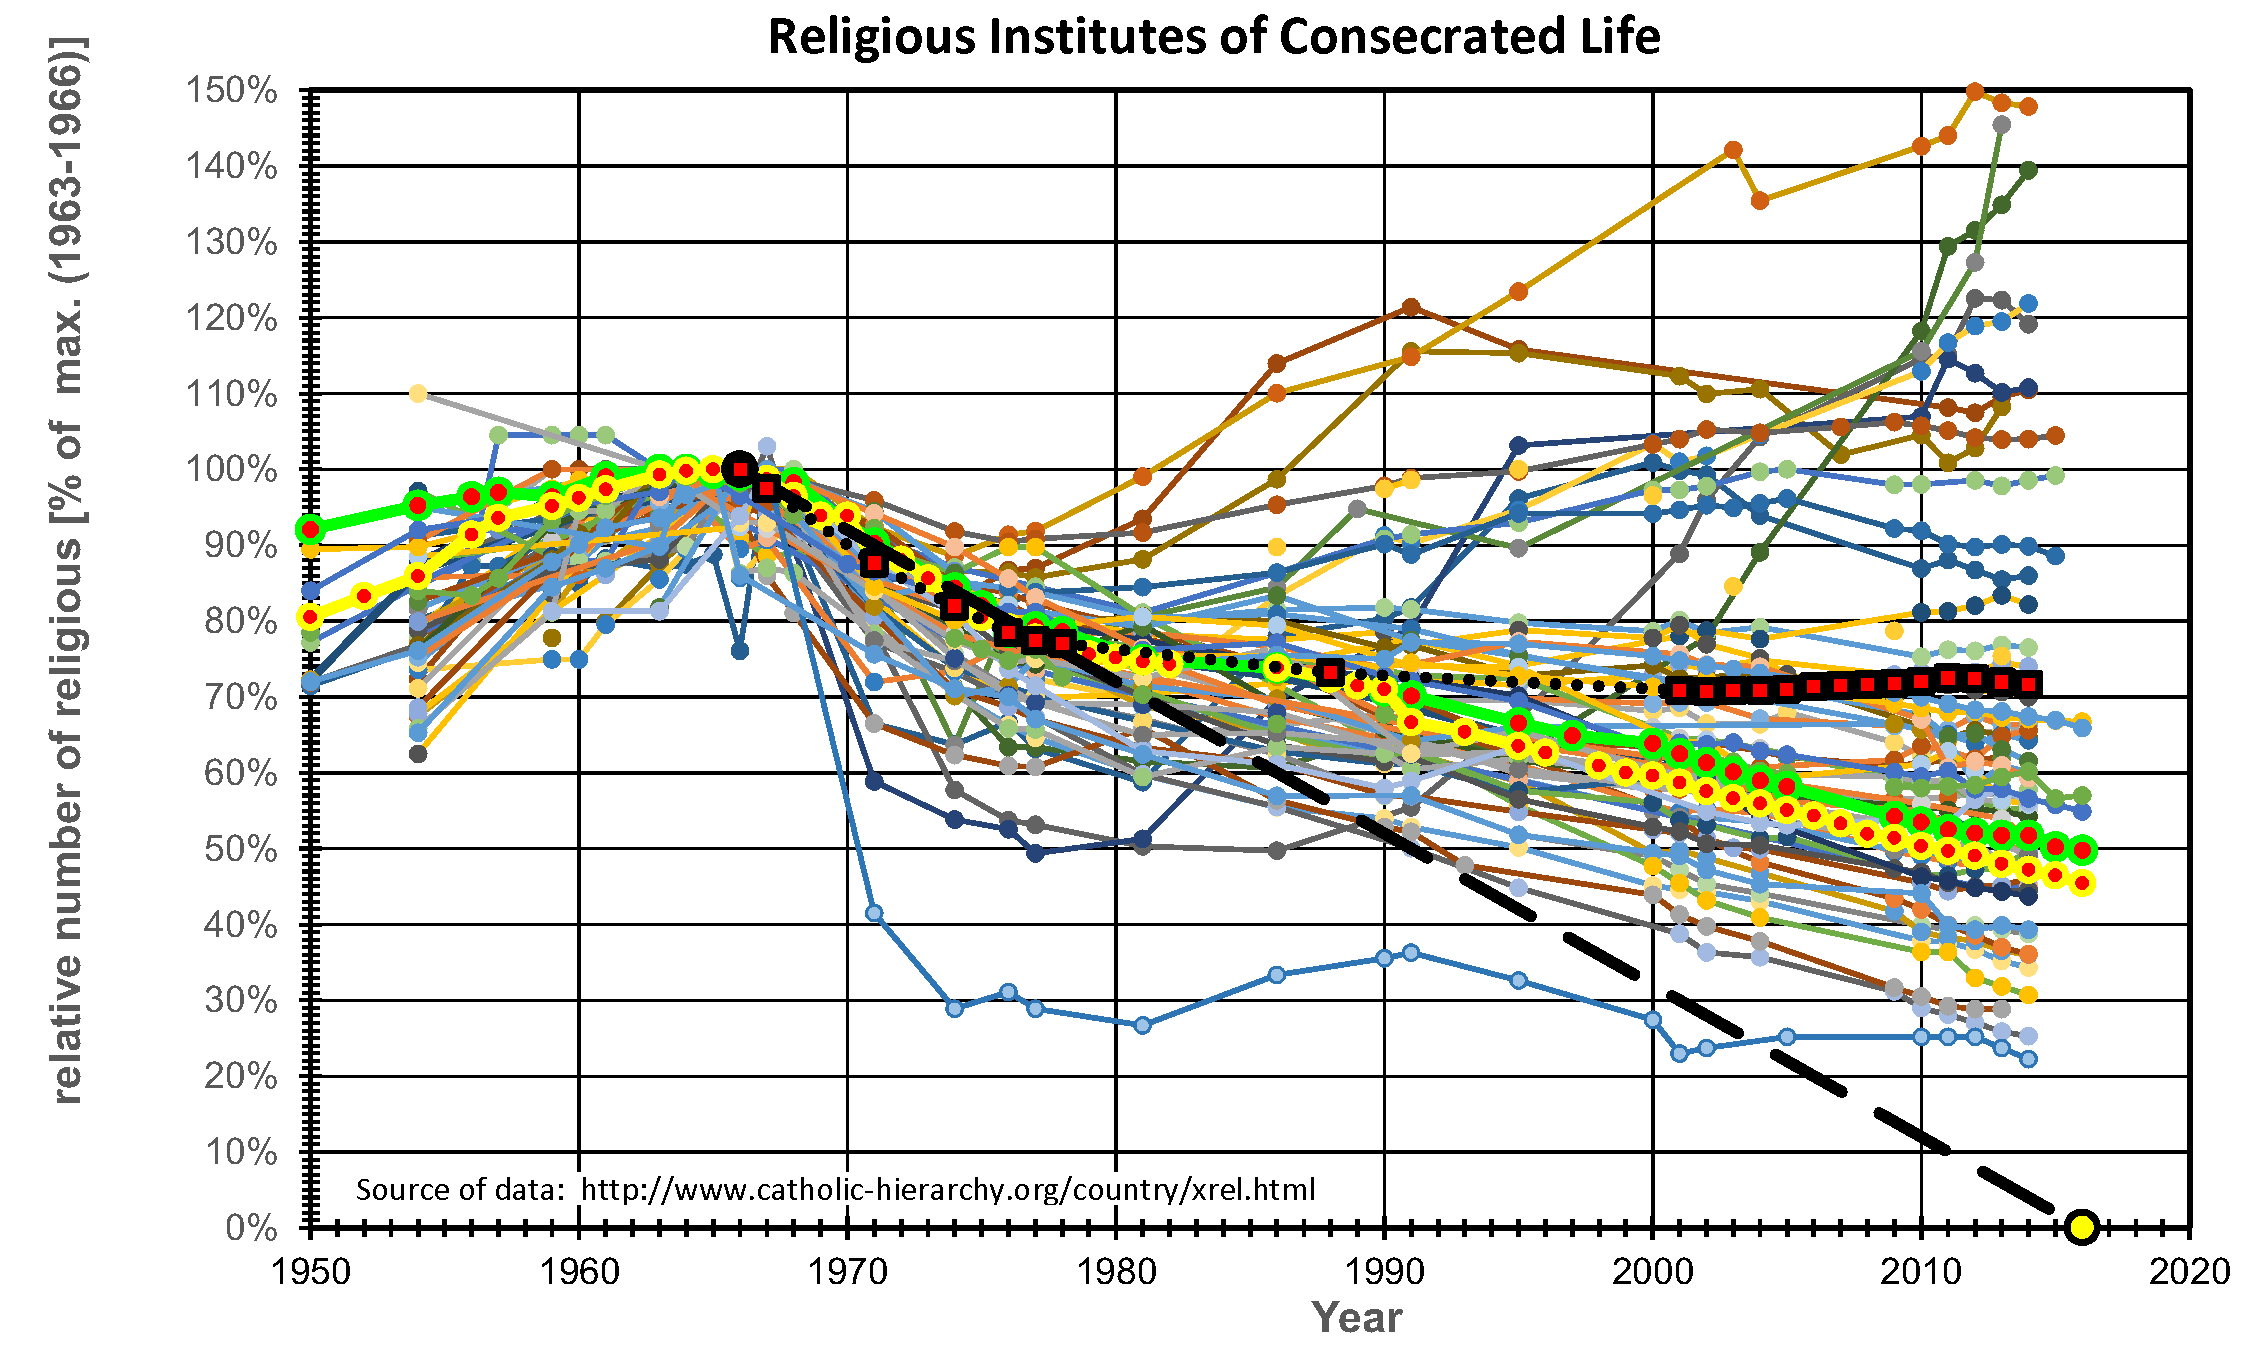
| Figure 6: Time-lines of 67 Institutes of Consecrated Life |
|
|
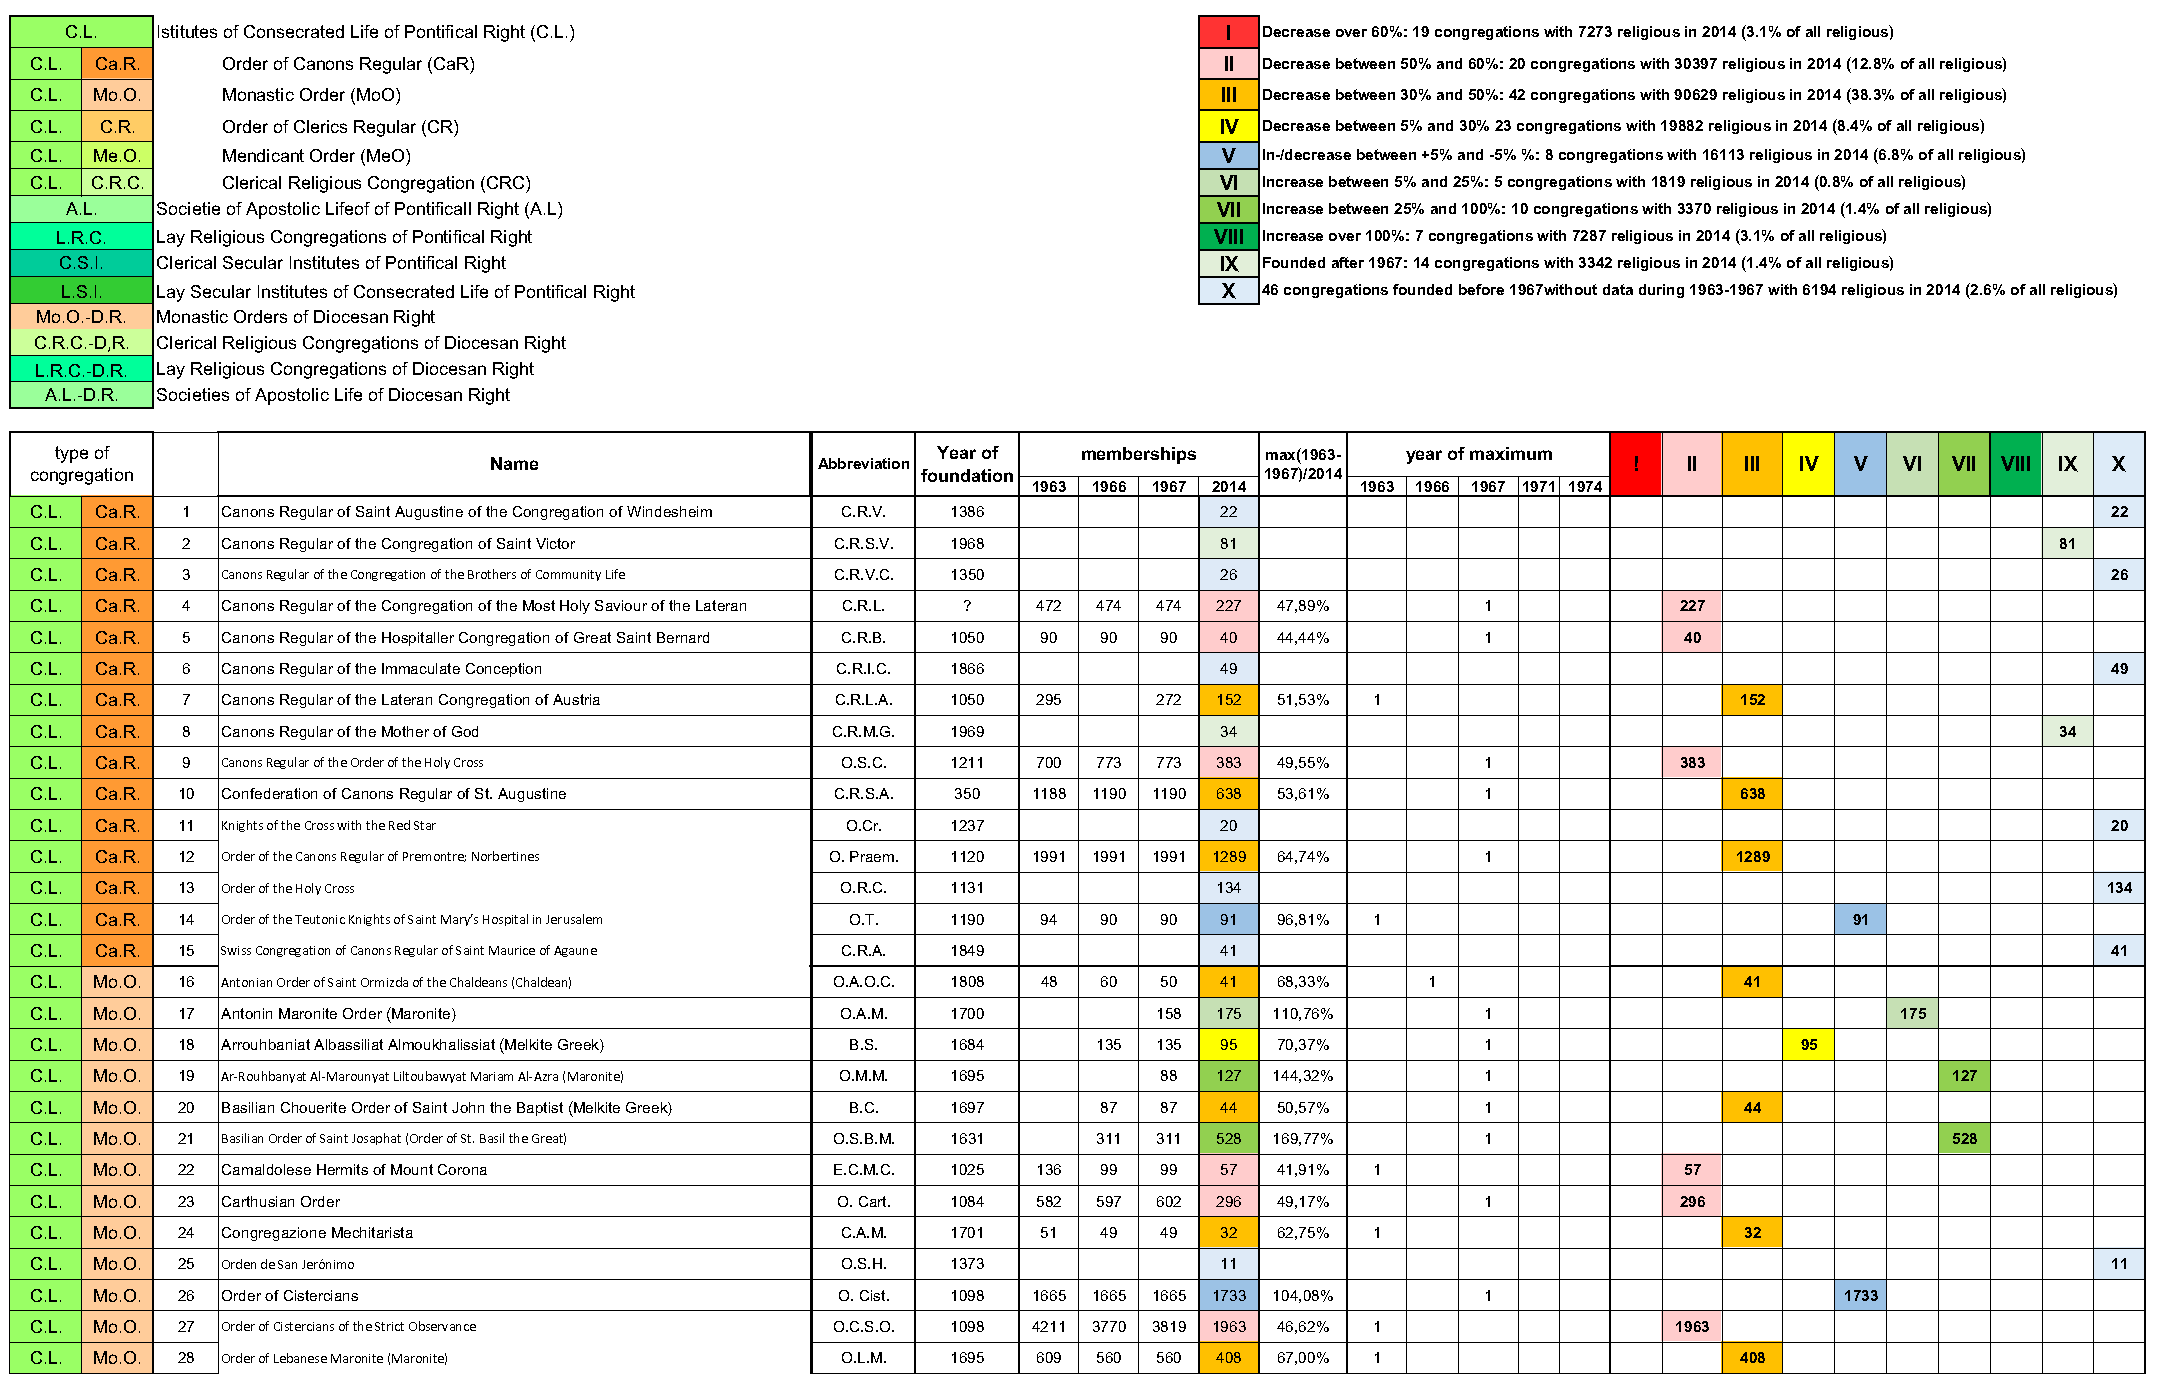
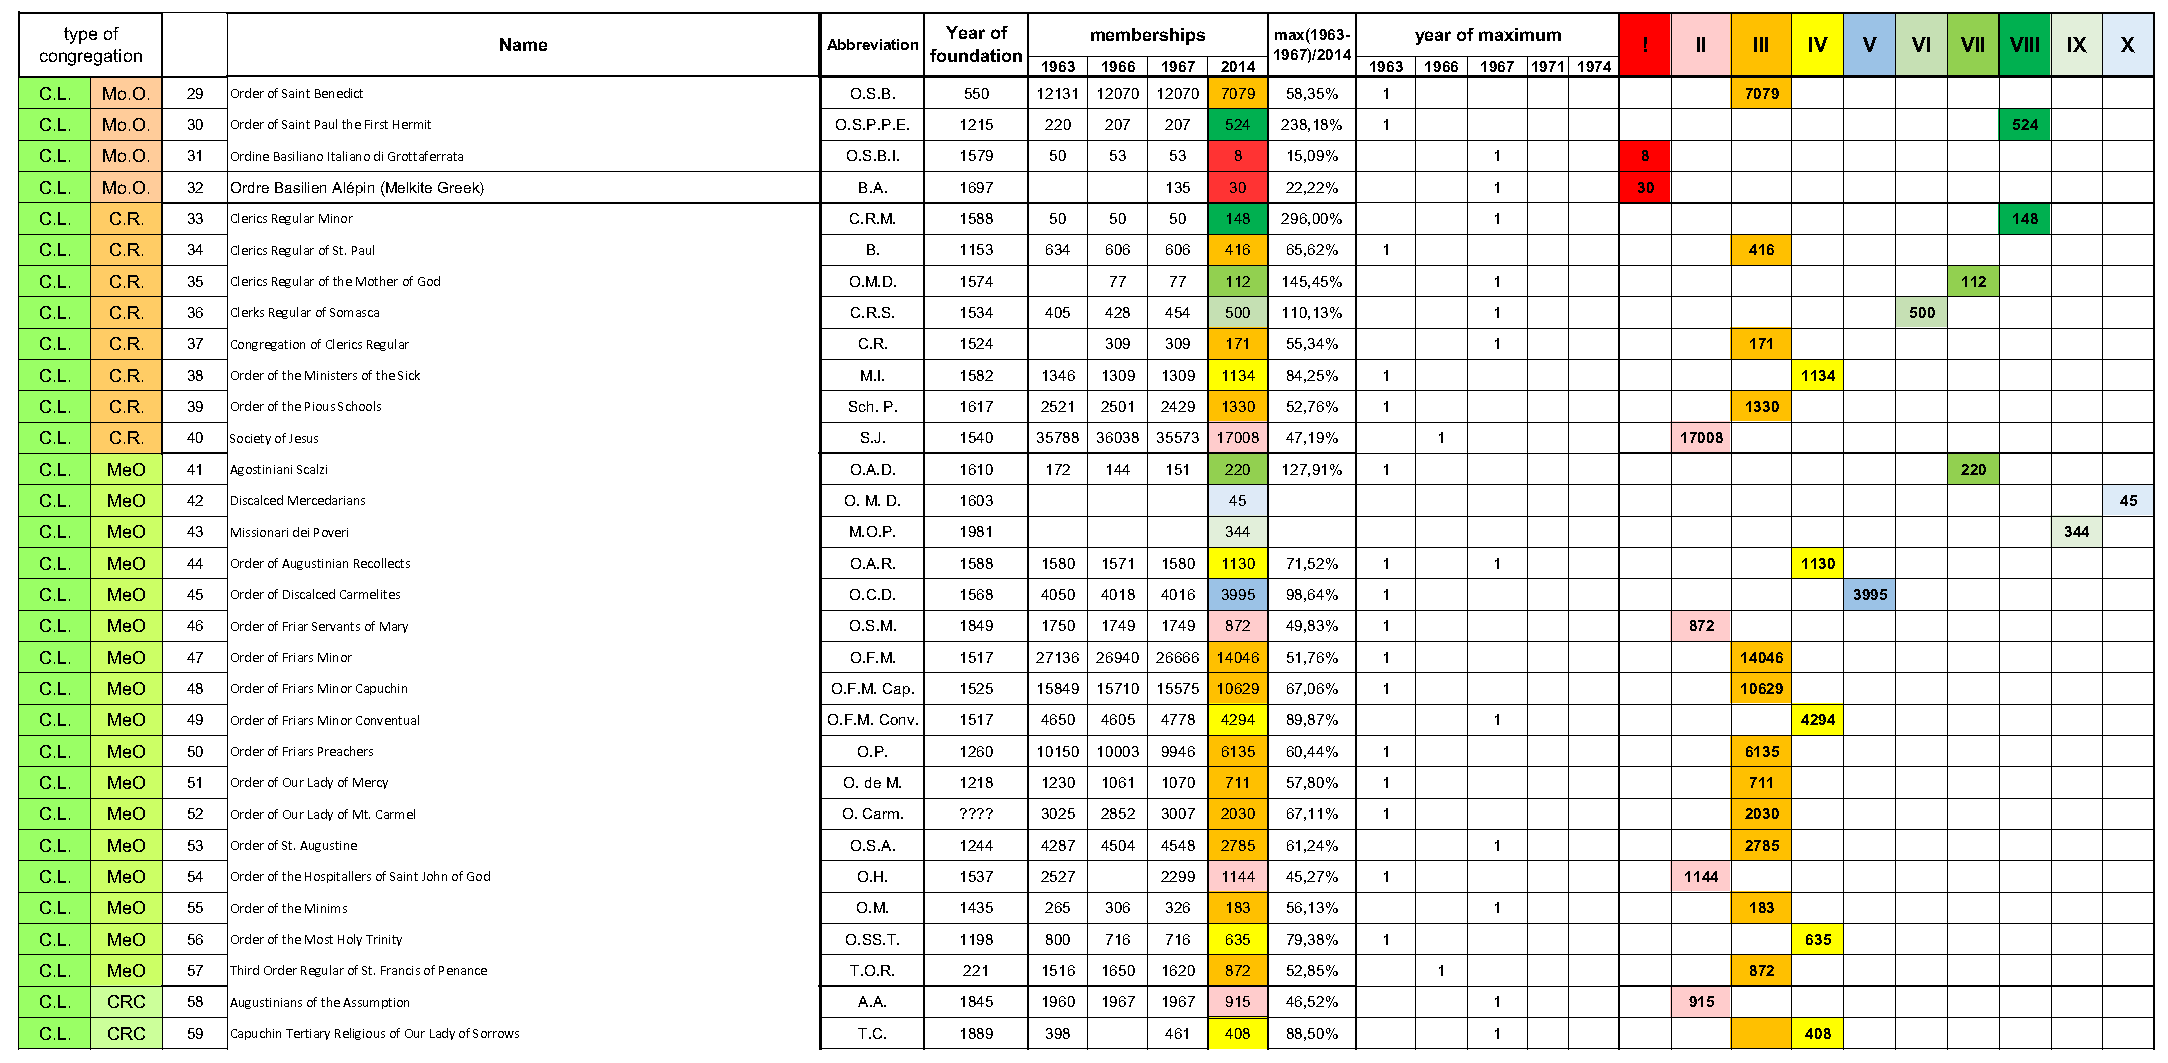
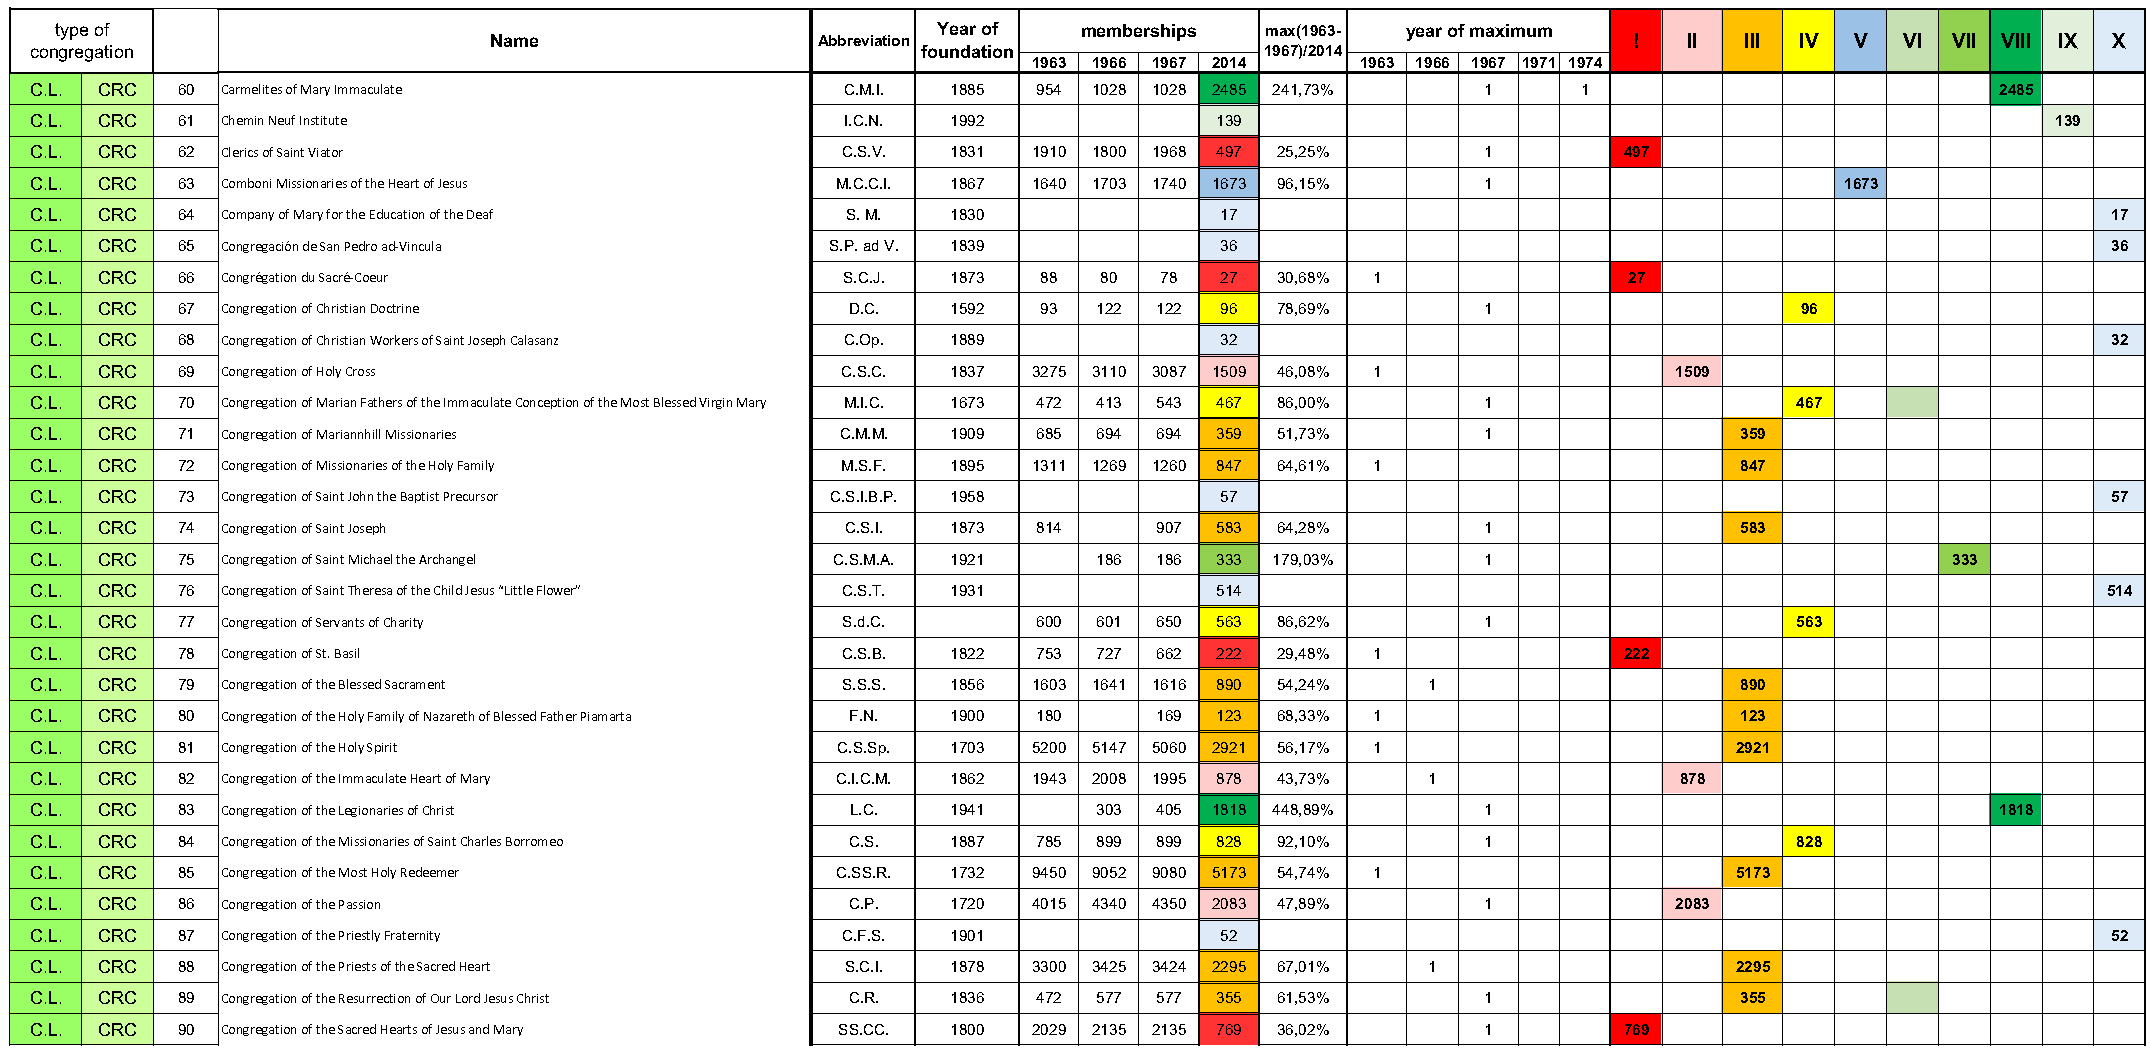
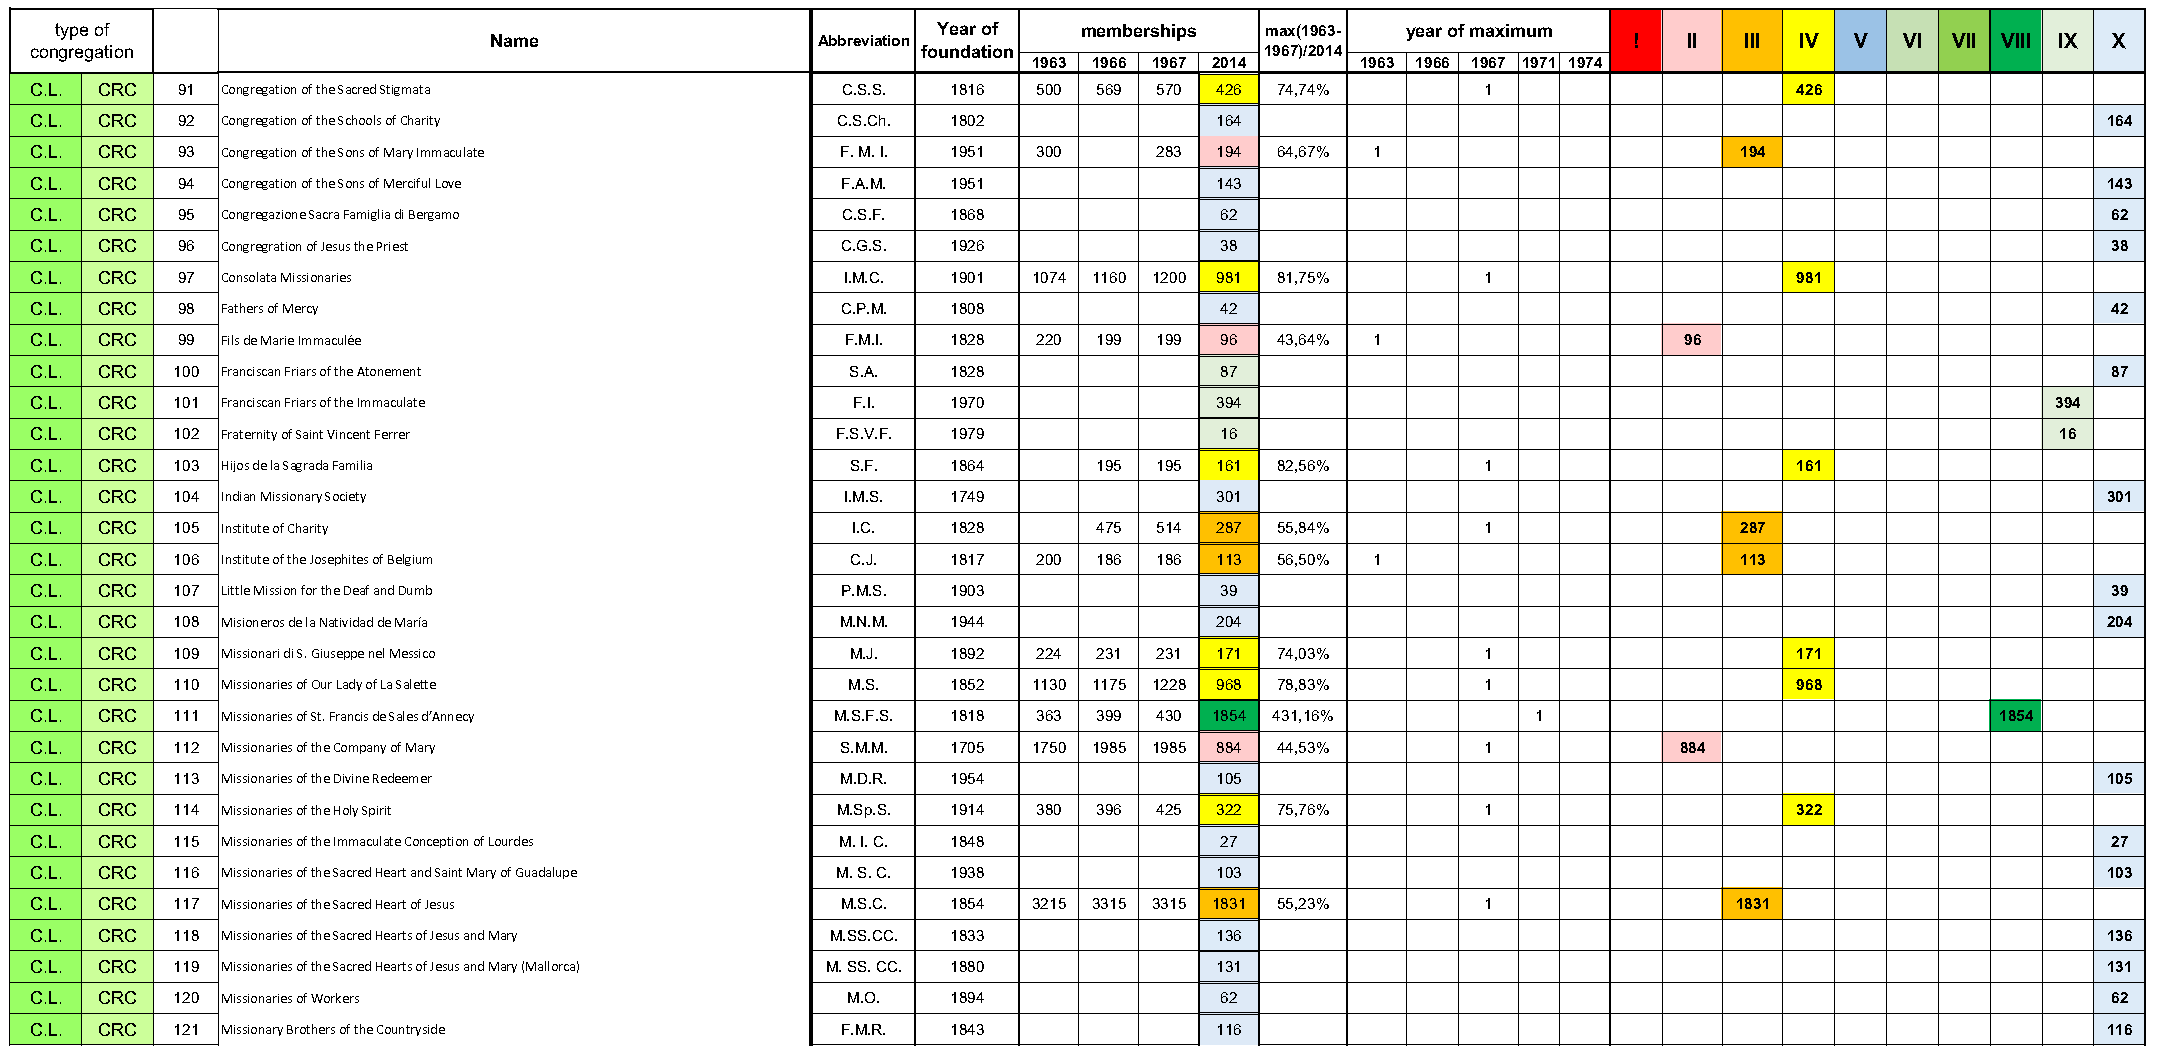
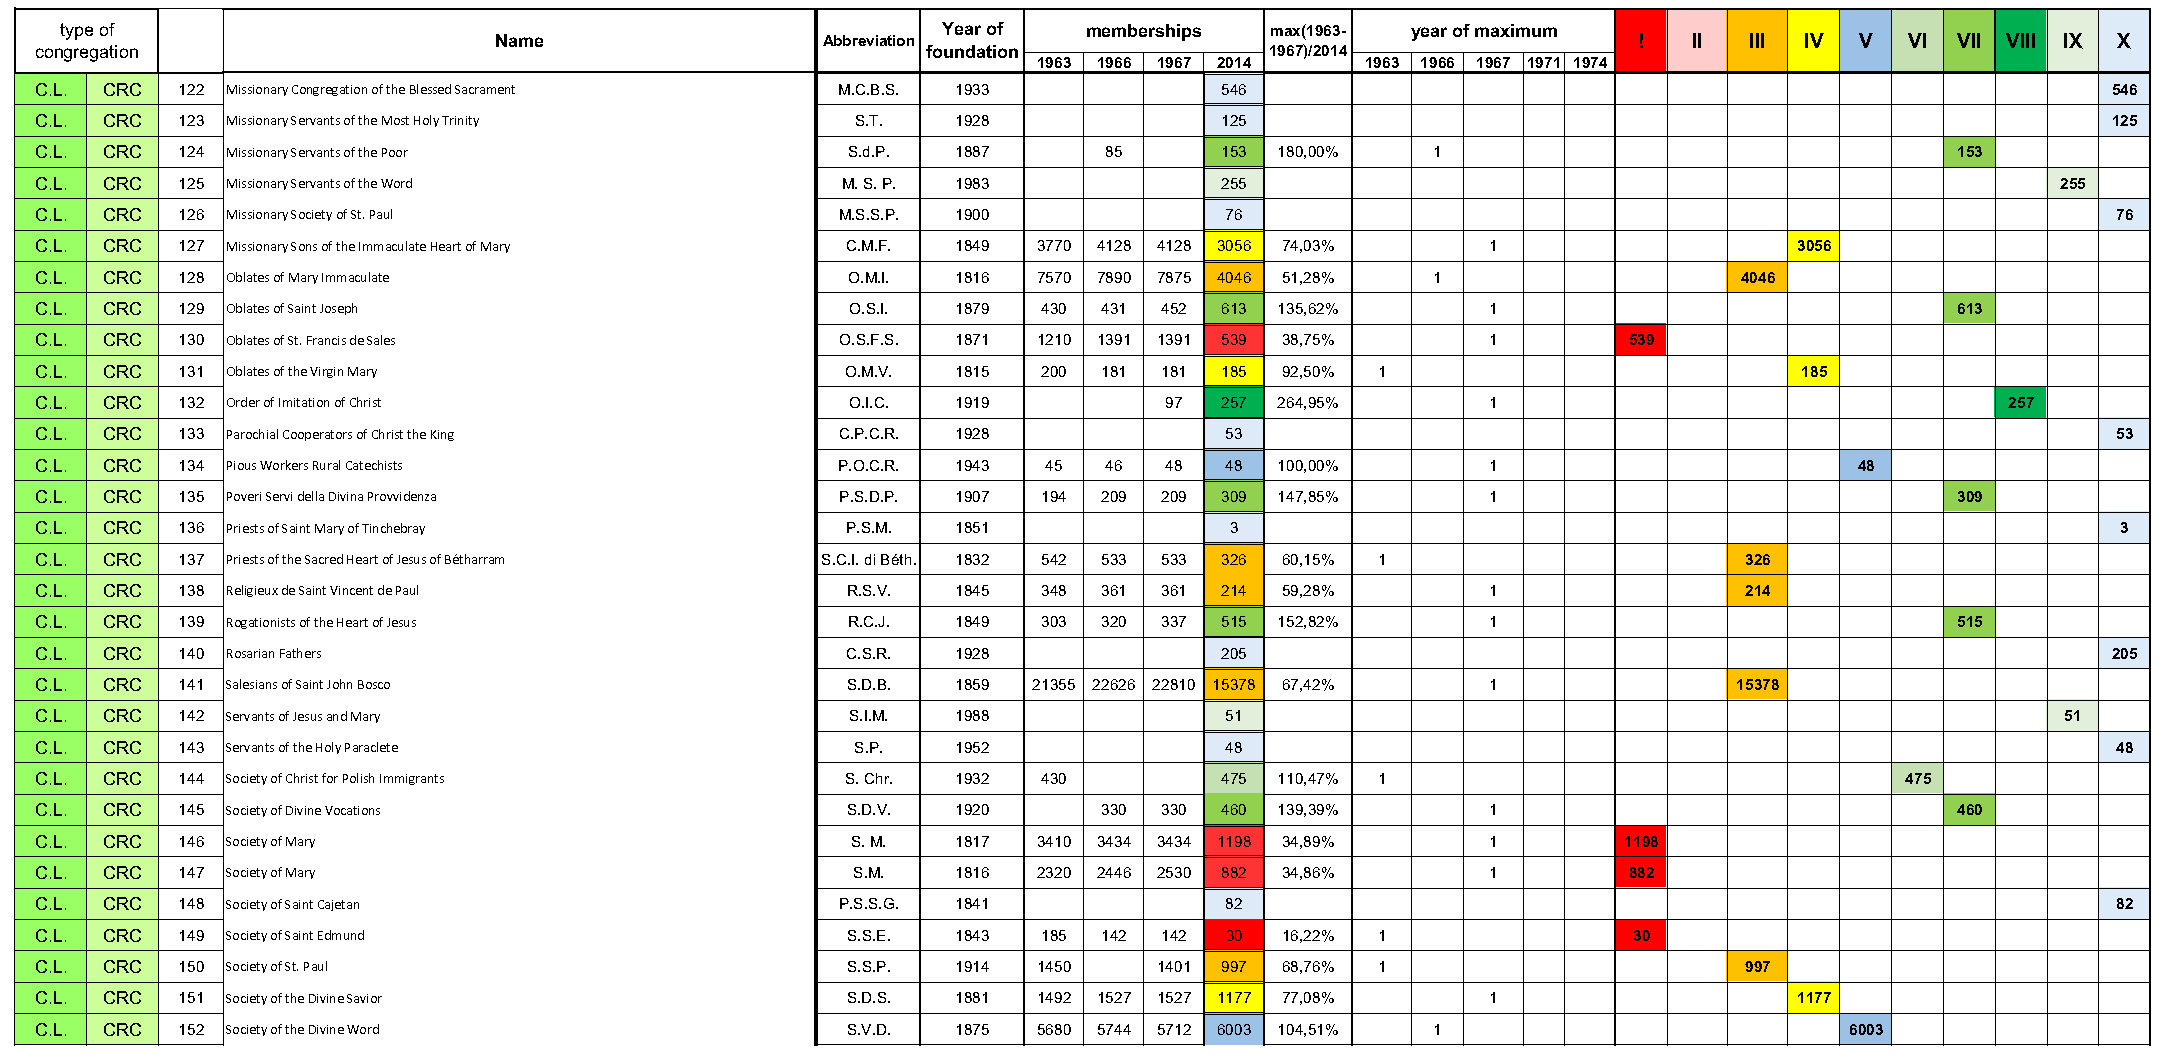
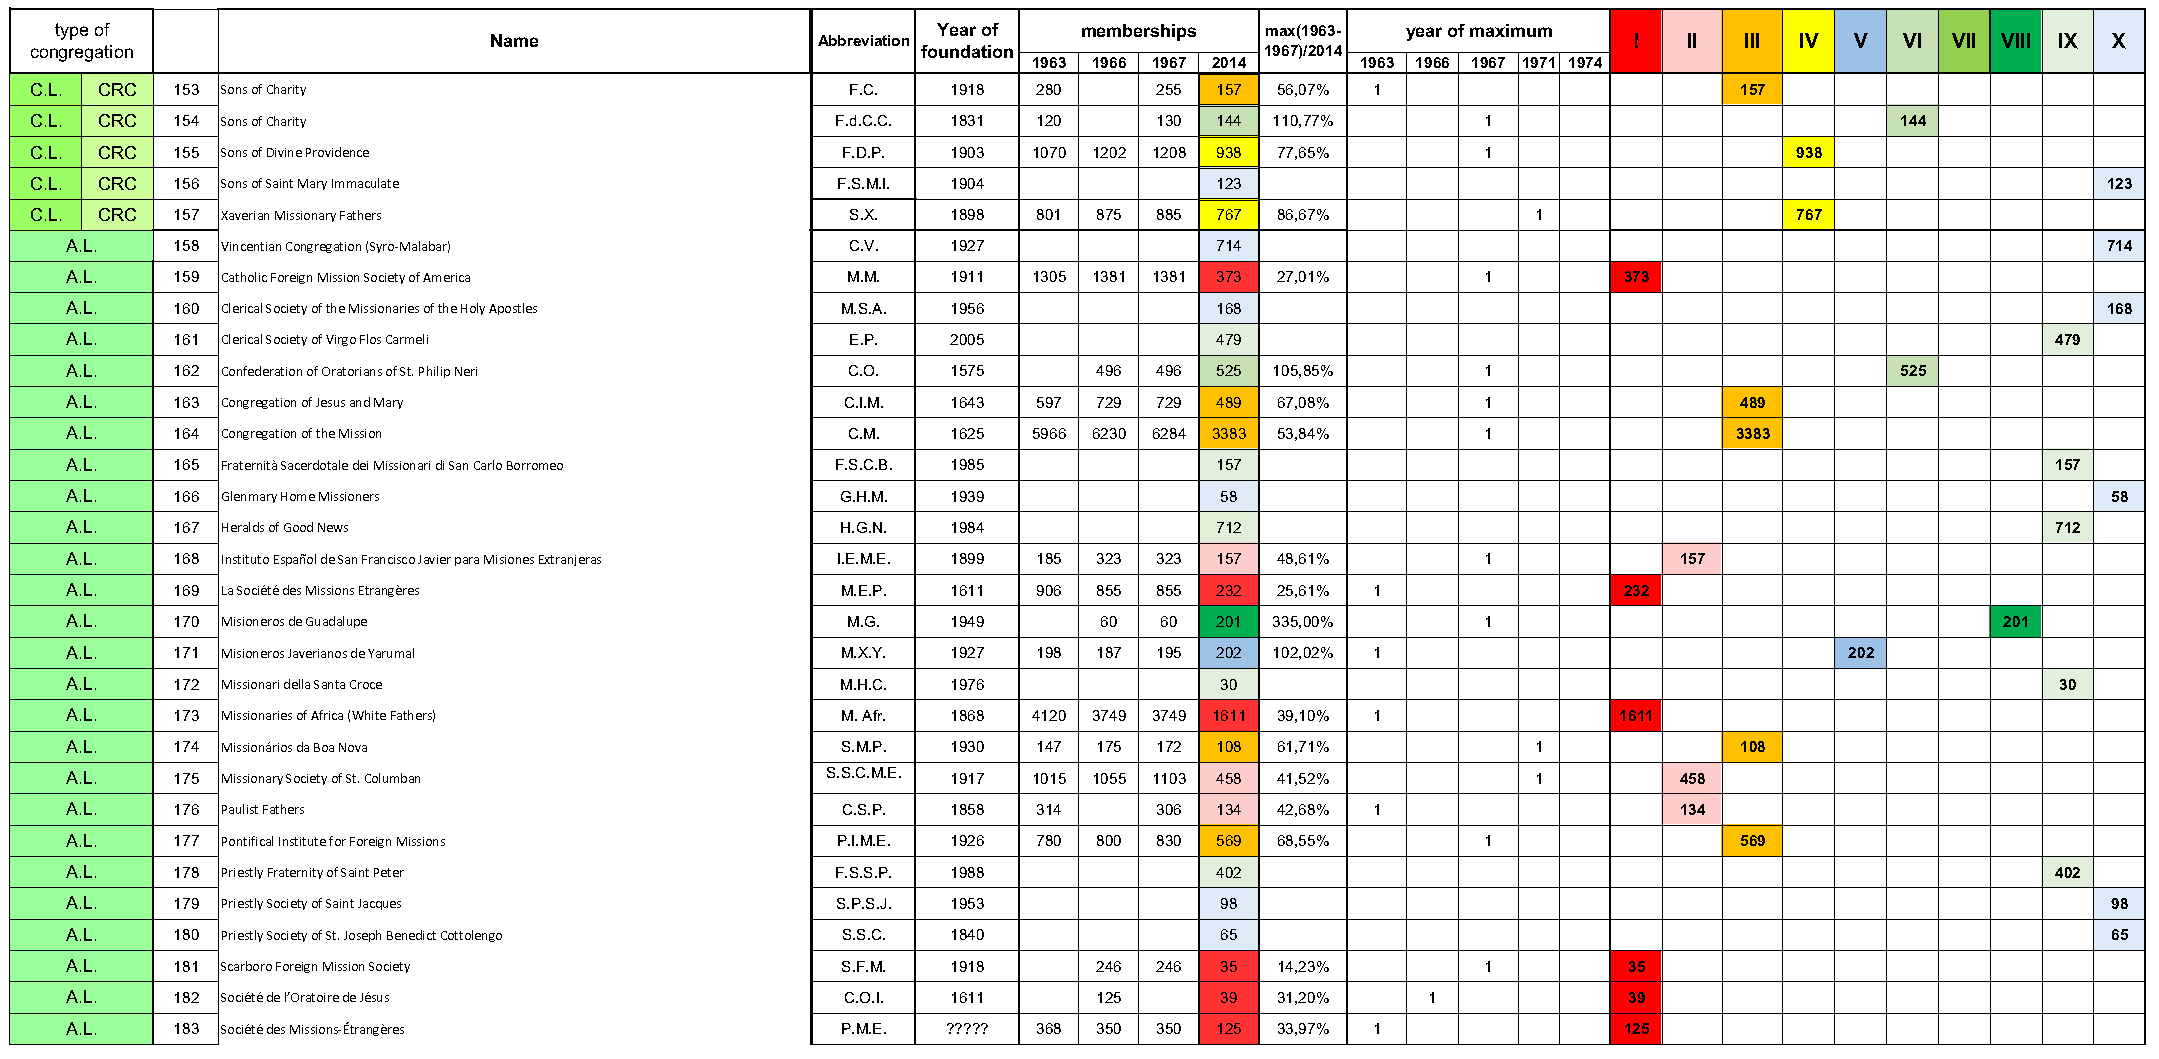
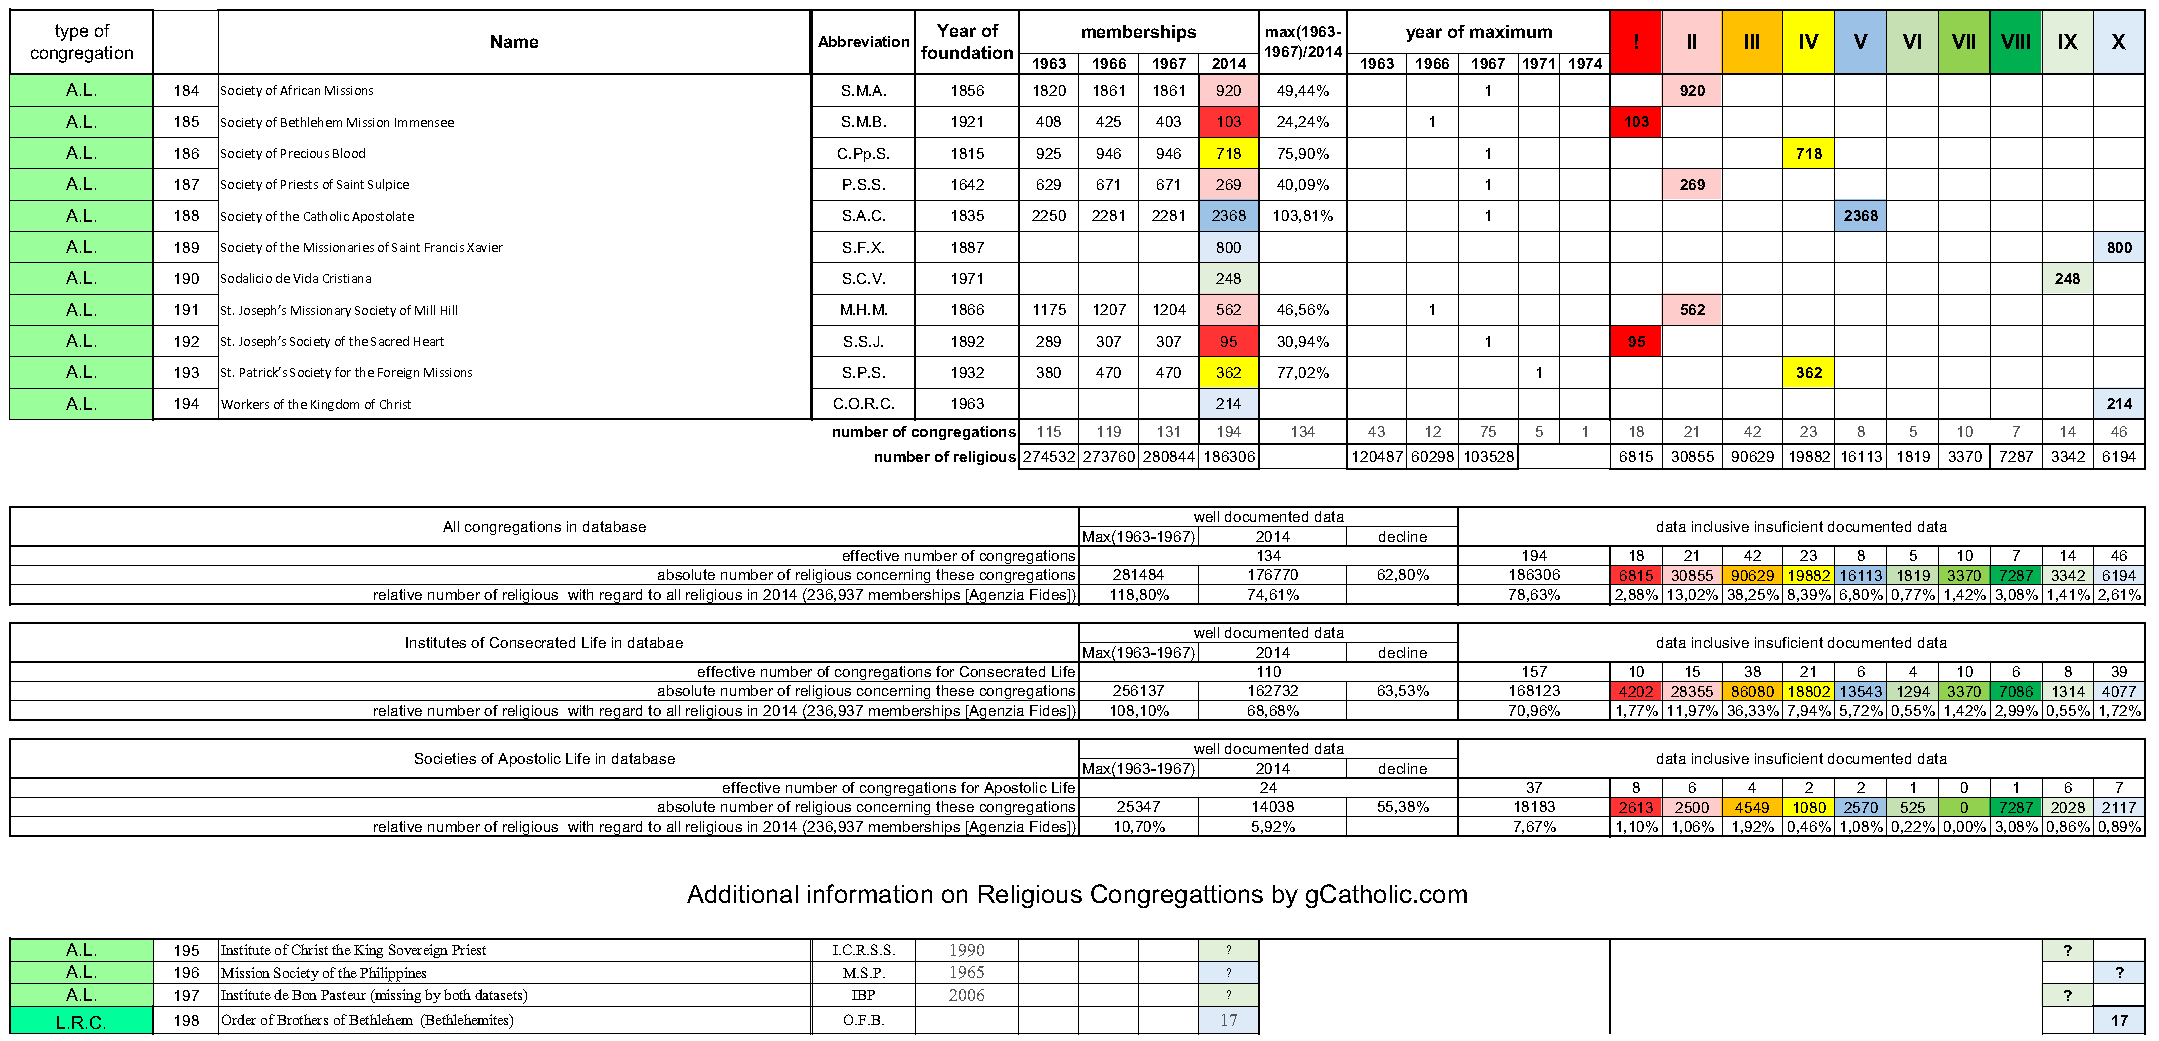
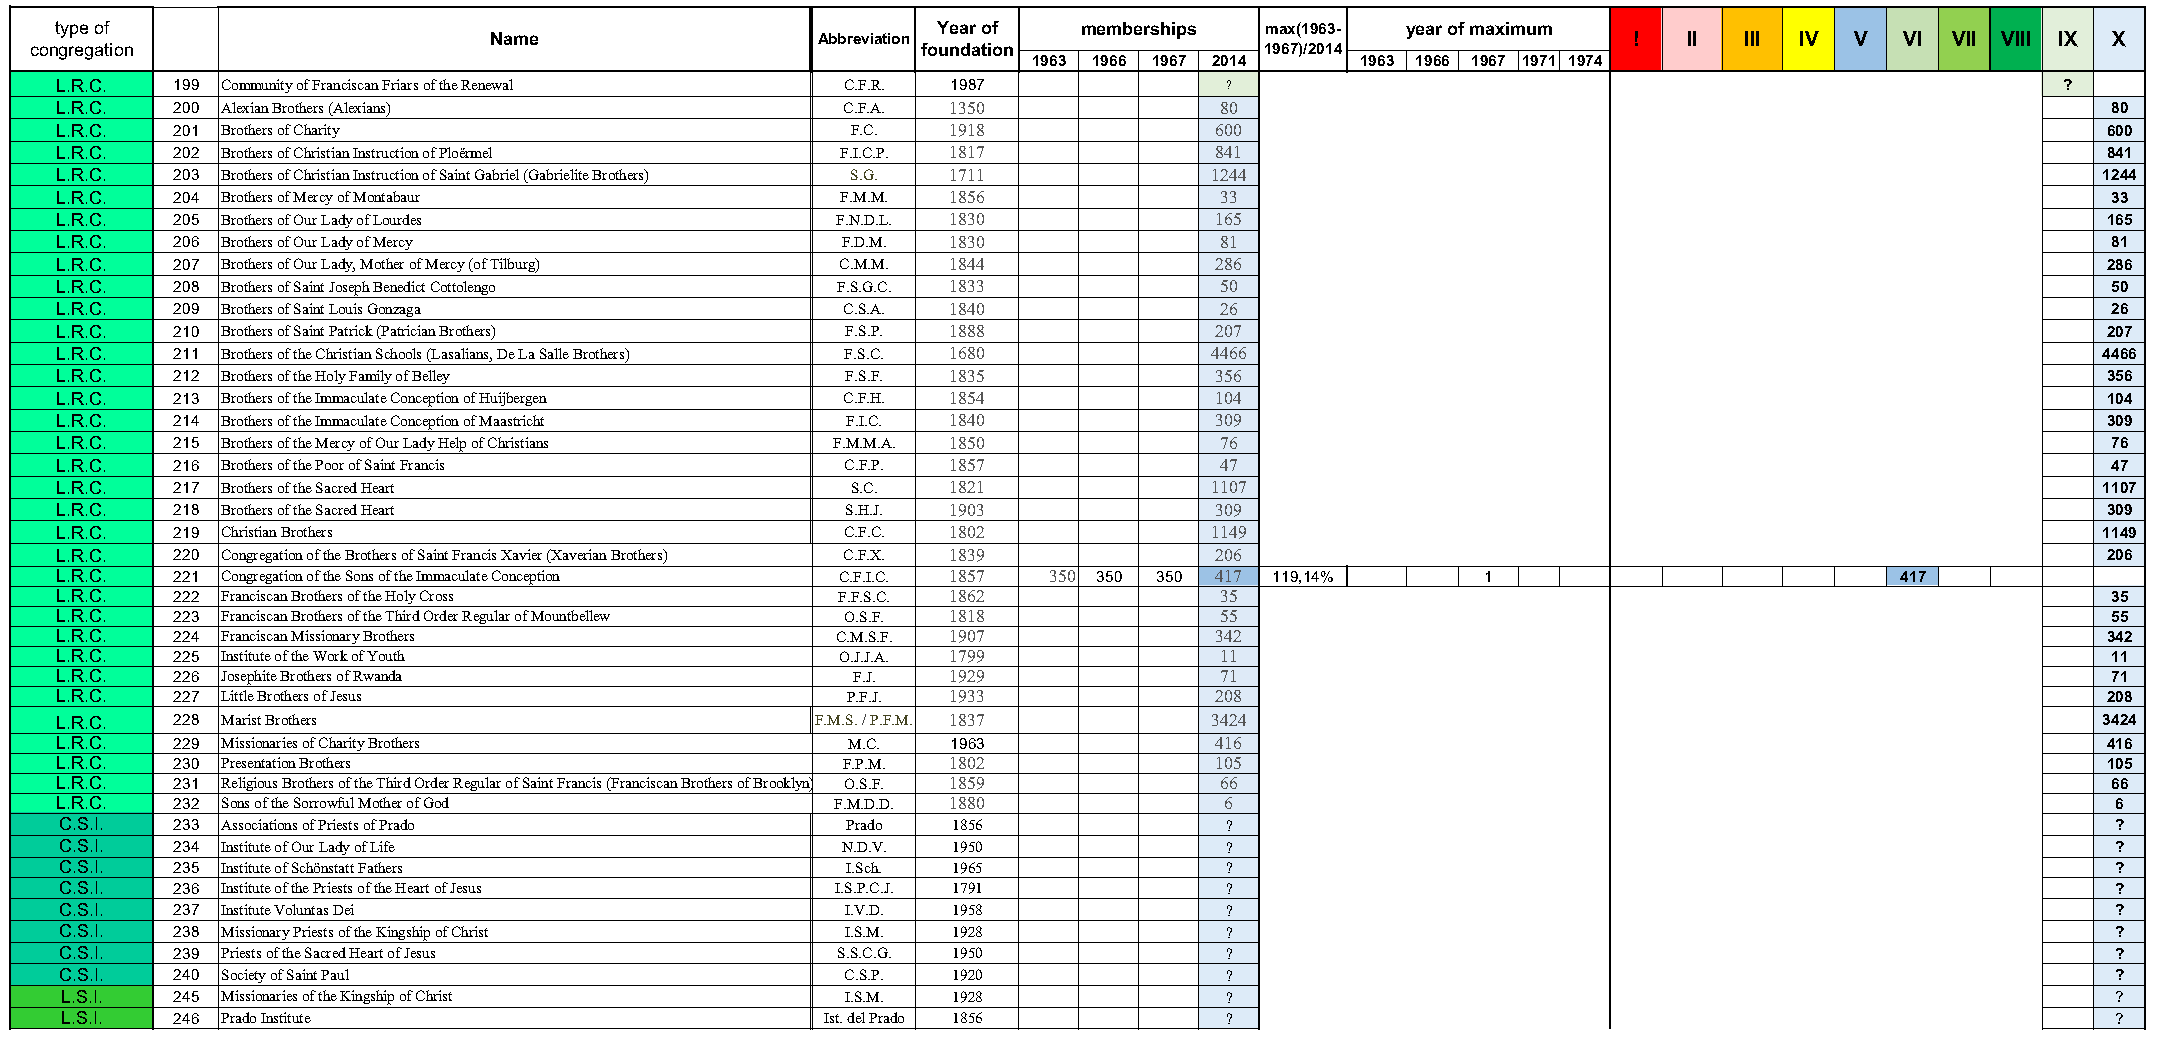
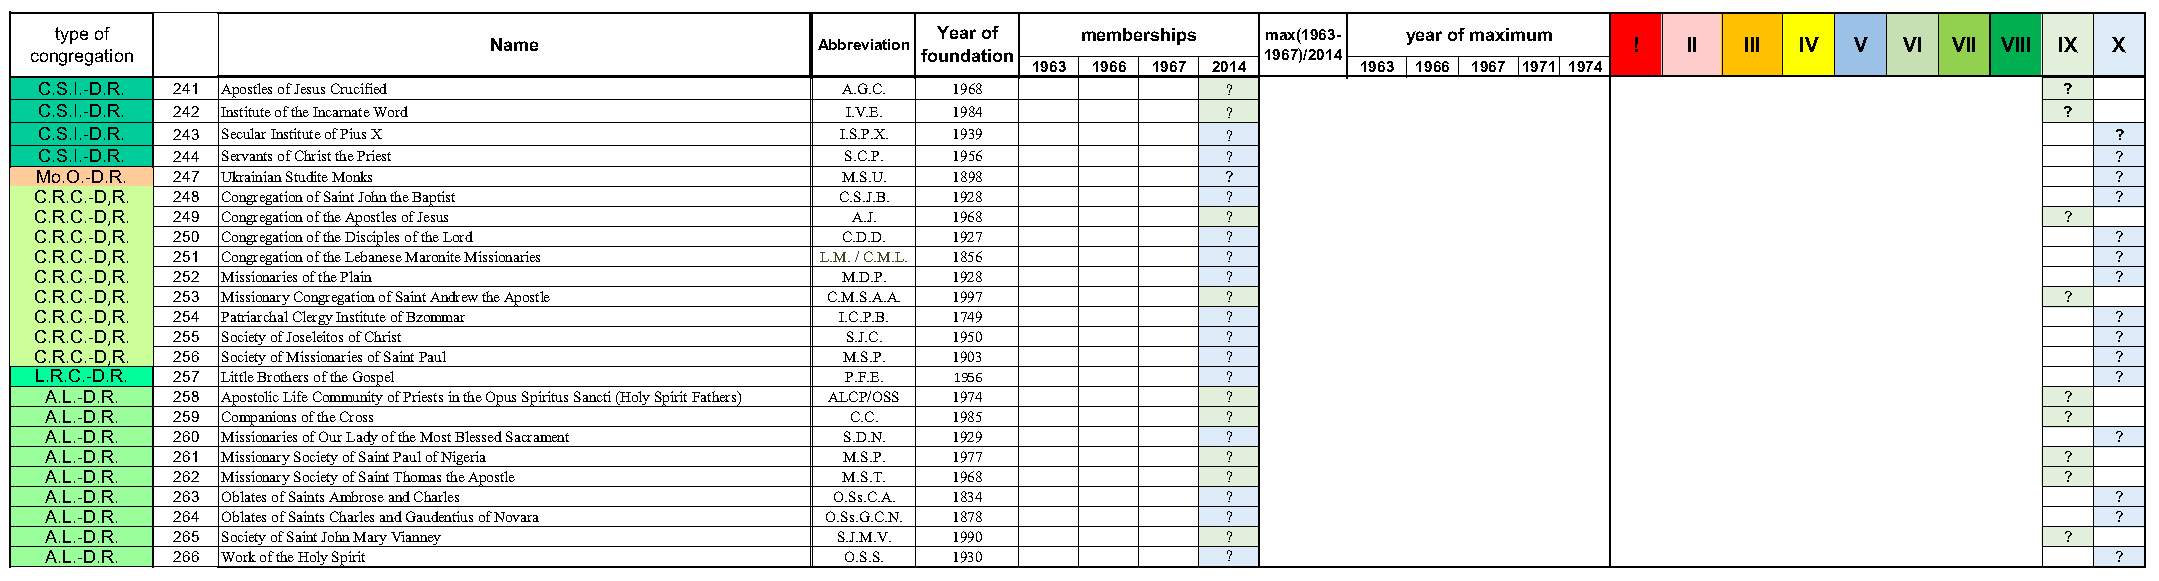
'The Hierarchy of the Catholic Church' [1] contains a well-documented dataset sufficient to determine individual timelines for 134 of 194 religious congregations regarding the period of at least 1966 to 2014.
Appendix I and Figure 6 provide an overview of the several congregations as well as the overall trends in this dataset. Regarding the 62 religious congregations with insufficient data 14 congregations are founded after 1966 while 48 congregations lack data for the period from 1950 till 1966. Table 1 provides an overall overview of this dataset combined with the dataset by Agenzia Fides [3] that provides the number of all religious for 2014. From this we can see that we have no data for about 21.4% of all religious.
Referring to those 134 well-documented religious congregations, we find 110 Institutes of Consecrated Life for which the membership has been reduced from 256,137 in 1966 to 162,732 in 2014. We also find 24 Societies of Apostolic Life for which the membership has been reduced from 25,347 religious in 1966 to 14,038 religious in 2014. This represents a total decline for these congregations of about 36.5% and 44.6% between 1966 and 2014 for the religious of Consecrated Life and Apostolic Life respectively.
Although we do not have sufficient data to determine the 1966 proportionality of these institutes to the total number of religious, it can be said that these 134 institutes represent about 74% of all religious in 2014. Furthermore 14 documented congregations representing about 1.5% of all religious in 2014 were founded after 1966 and therefore counted zero in 1966. Here it has to be said that these 14 well-documented congregations are not a complete list of those founded after 1966.
Generally, the statistical data available shows that a vast majority of institutes underwent an increase in the number of male religious prior to 1963 with a rate of increase varying from 0.5% to 2 %/year. Considering an estimated average religious lifetime of about 50 years, a natural rate of decline of -2%/year can be expected if there are no new vocations during that time. That would mean that the rate of increase before 1963 can be compared with an effective vocation rate of 2.5 to 4 % per year or an average of 1.25 to 2 religious vocation inspired during the religious lifetime of each religious. Regarding the 134 well-documented religious congregations, this led to a maximum of 281,848 religious in 1966.
Note that an average inspiration of 1 vocation during a religious lifetime for each religious results in a constant number of religious per congregation. In case of growth of the number of faithful, such a vocational growth rate would indicate a relative decline in the religiousness of the congregation.
During and immediately following the Second Vatican Council, a sharp decline began that, with a few exceptions, continues to the present. The turning point at which the decline begins varies typically between 1963 and 1966. Regarding the 134 well-documented congregations, we can pinpoint the beginning of the decline on the basis of membership. About 32% of the congregations, representing 118,907 religious (including the Franciscans Minor, Capuchins, Dominicans, Redemptorists and Benedictines) had their statistically registered maximum membership in 1963. About 9%, representing 60,289 religious (including the Jesuits and the Society of Divine Word) statistically registered their maximum in 1966. About 55% of these congregations (including the Salesians) representing 102,548 religious met this maximum membership in 1966. Only a few congregations (5%) were observed to find their maximum membership in the early seventies.
The vast majority of the religious of Consecrated Life were subject to a precipitous vocation decline during the first decade after the Council.
Within this first decade an average decline appeared of about 20% of the 1966-level instead of the continuation of an ongoing growth of about 10% over such period.
Within this first decade an average decline appeared of about 20% of the 1966-level instead of the continuation of an ongoing growth of about 10% over such period.
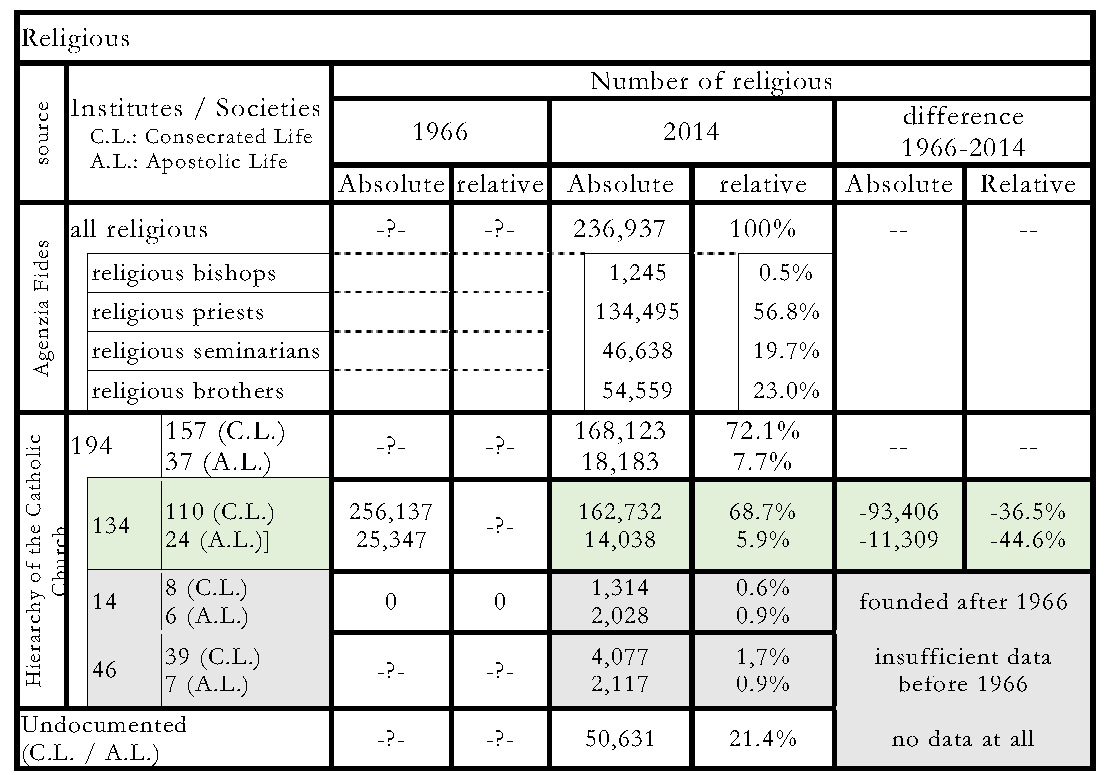
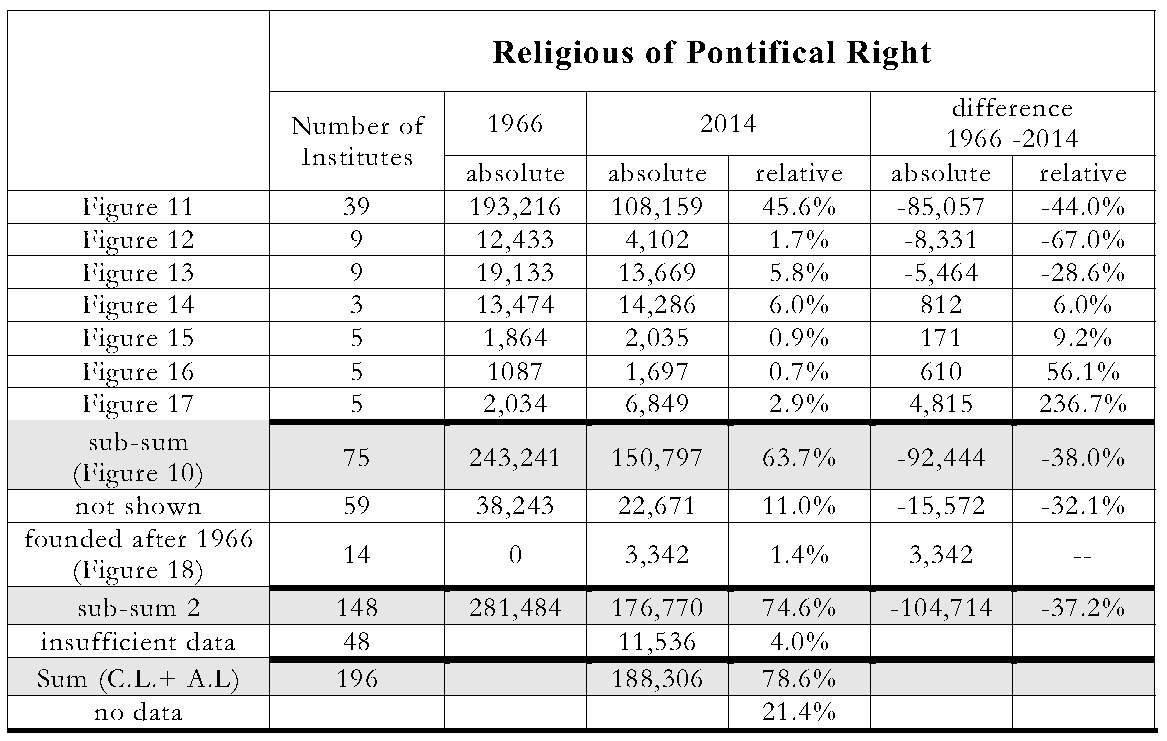
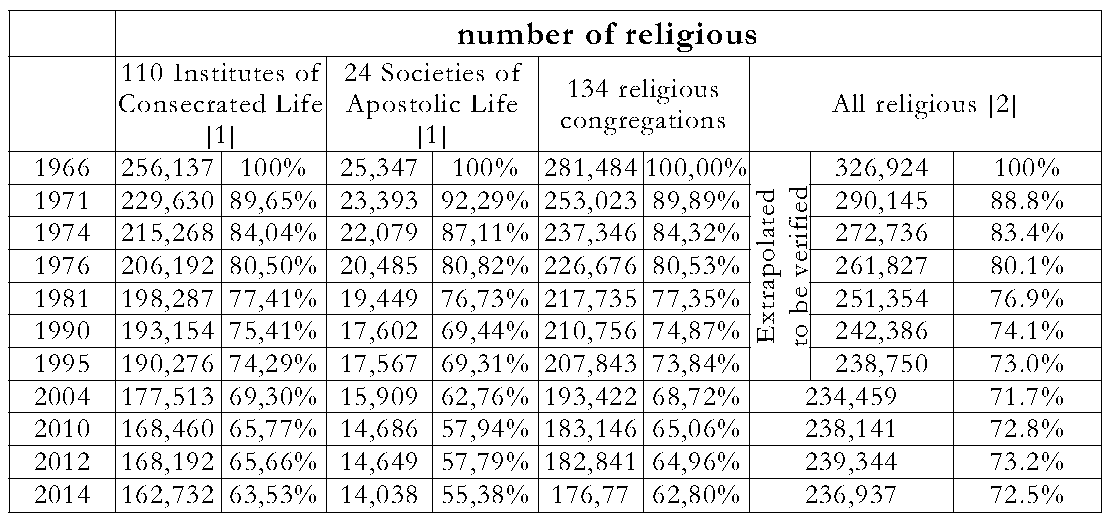
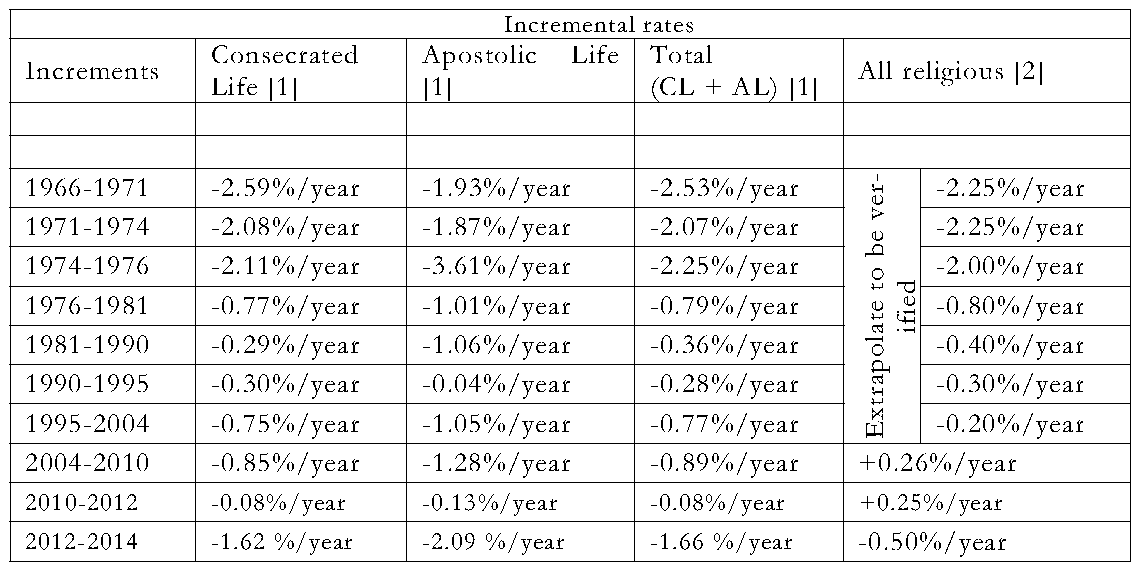
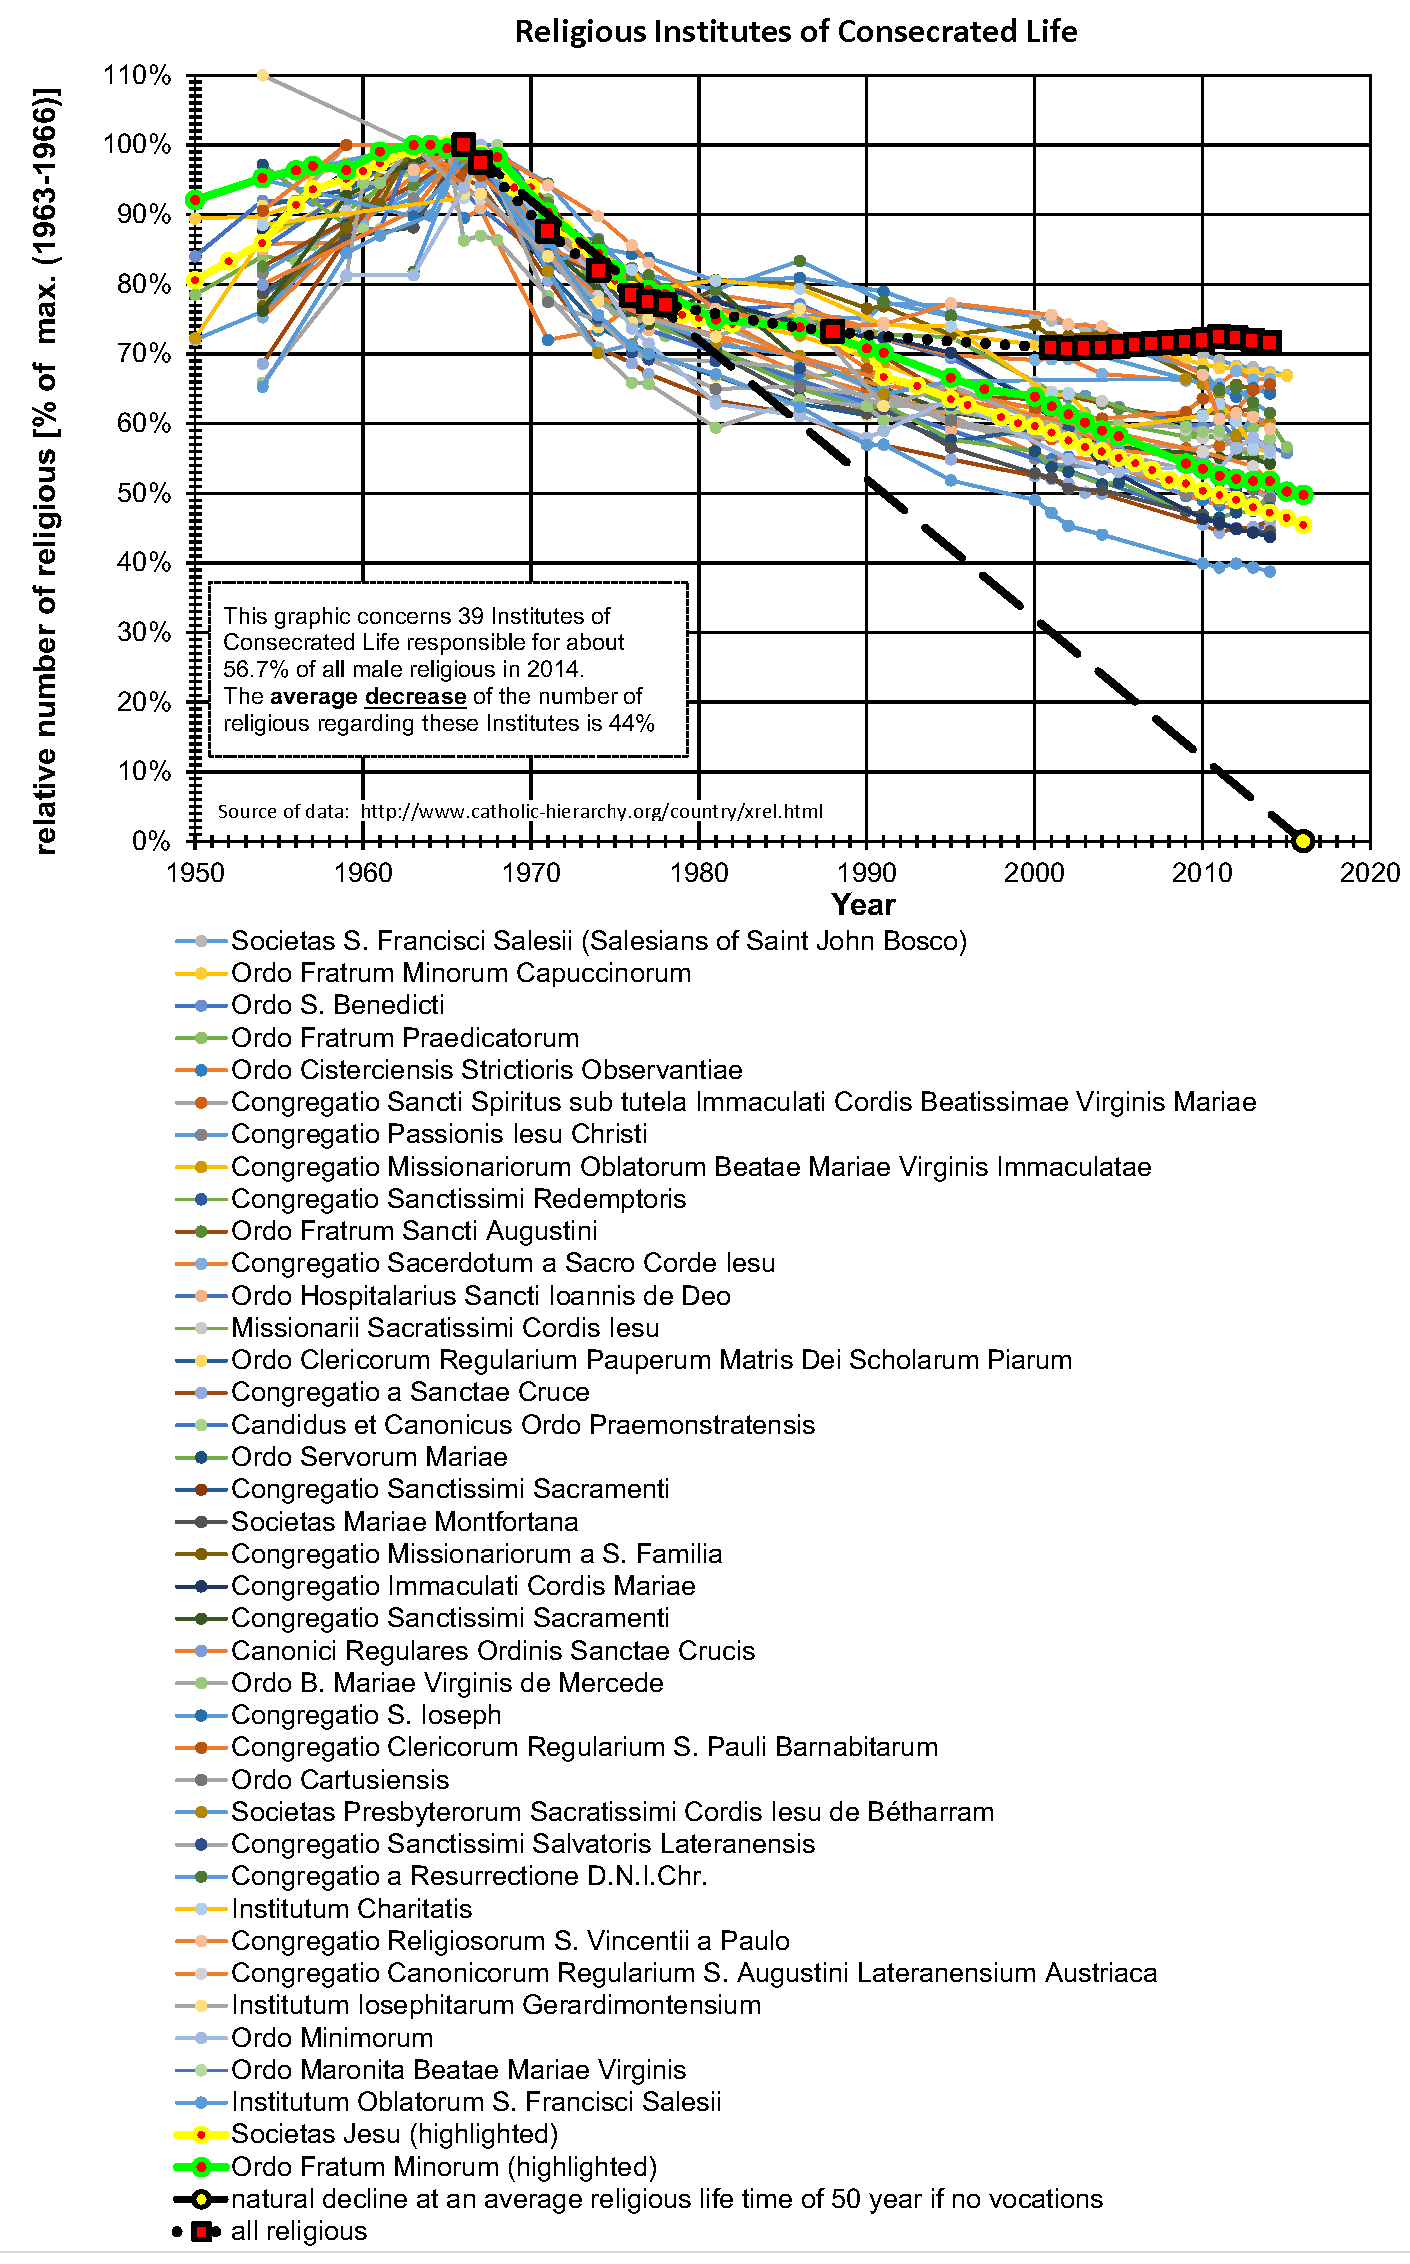
Table 2 contains data from 75 Institutes of Consecrated Life, representing about 63.7% of all religious. This data is displayed in figures 11 to 15. The first two rows show for 48 congregations representing 47.3% of the religious in 2014 a serious average decline of 44% and 67% respectively. Furthermore, looking at the row 'sub-sum 2', it is clear that that even though there may be some modest growth among some of the congregations, such as those founded after Vatican II, there is nonetheless a total average decline of 37% of all of the well documented congregations including the congregations founded after Vatican II.
As previously mentioned, the vast majority of the 110 Institutes of Consecrated Life and 24 Societies of Apostolic Life (for which we have sufficient data) show vigorous growth before 1963. Between 1963 and 1966 this steady growth stalled and was followed by a decline that continues up to the present.
Table 3 and Table 4 concern the average timeline of all religious represented by the 134 well-documented religious congregations starting at the maximum number of the religious in 1966 and tracking the decline from there to 2014. Table 3 distinguishes between the religious of Consecrated Life, Apostolic Life, the total of these religious [1] and the total number of religious as provided by Agenzia Fides [3]. Table 3 also indicates the absolute numbers of religious and the percentage relative to the 1966 maximum.
Table 4 provides the incremental rates regarding the distinctions made in Table 3 expressed by %/year. The percentages show incremental decline of the number of religious relative to the start of that specific increment. Table 3 shows an average decline to a level of 55.4% for the Societies of Apostolic Life, and a decline to a level of 63.5% for the Institutes of Consecrated Life. According Table 4, the way to these declines differs a lot. While both data sets indicate a serious decline, they differ somewhat in manner. While the average declining rate for the Societies of Apostolic Life starts from 1966 to 1974, it is moderate as compared to the Institutes of Consecrated Life. During the period from 1974 to 1976 the decline for the Apostolic Life appears more extreme. Furthermore, it appears that for both type of religious, the average decline during the first decade after 1966 was about 20% while next 20% decline till the present time took about 40 years. Table 4 also shows the average decline of the 134 religious congregations to be about -2%/year after December 31th, 2012.
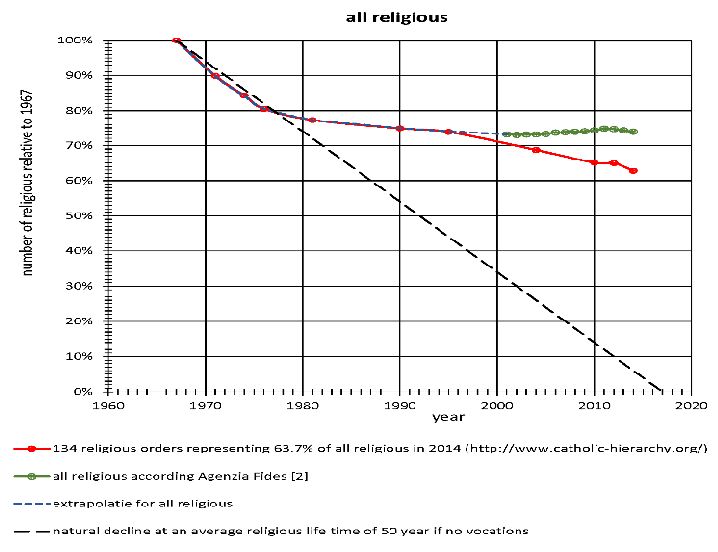
| Figure 7: Reconstruction of the timeline of all religious | |
 |
 |
The observed changes of the number of all religious is much smaller than indicated by the 134 religious congregations provided by 'The Hierarchy of the Catholic Church' [1]. Approximately 25% of the religious, including a number of religious groups founded after the Second Vatican Council, compensate for the average decline of the 134 religious congregations that represent about 75% of all religious in 2014. The average magnitude of such compensation is approximately +3%/year to 4%/year.
Note that the rather constant number of all religious during the period 2001 to 2014 (Figure 1) can be compared to the timelines of the restricted 134 well-documented congregations which represented about 74% of the religious in 2014. The dramatic decline from more than 281,484 religious in 1966 to 236,937 in 2014 cannot be denied. Extrapolating the increasing rate for all religious of about 0.15%/year during 2001 to 2012 into the past to 1976 means that in 1976 the 134 well-documented congregations would represent about 90% to 95% of all religious. Therefore, it can be concluded that the decline between 1966 and 1976 concerns about 20% of the number of religious in 1966, while during the following two decades, the decline more and more stabilized to about 30% in 2000, where even a slight increase occurred of about 2.5% till 2012. After 2012, again a slight decline of the number of all religious can be observed (Figure 7).
4 Methodology
The multiple timelines in figures 10 to 17 of this section group together data from specific congregations for the sake of comparison. By grouping them in this manner, we can discover similarities among the growth or decline of these institutes, which in turn must indicate similarities in their spiritual qualities as described above.
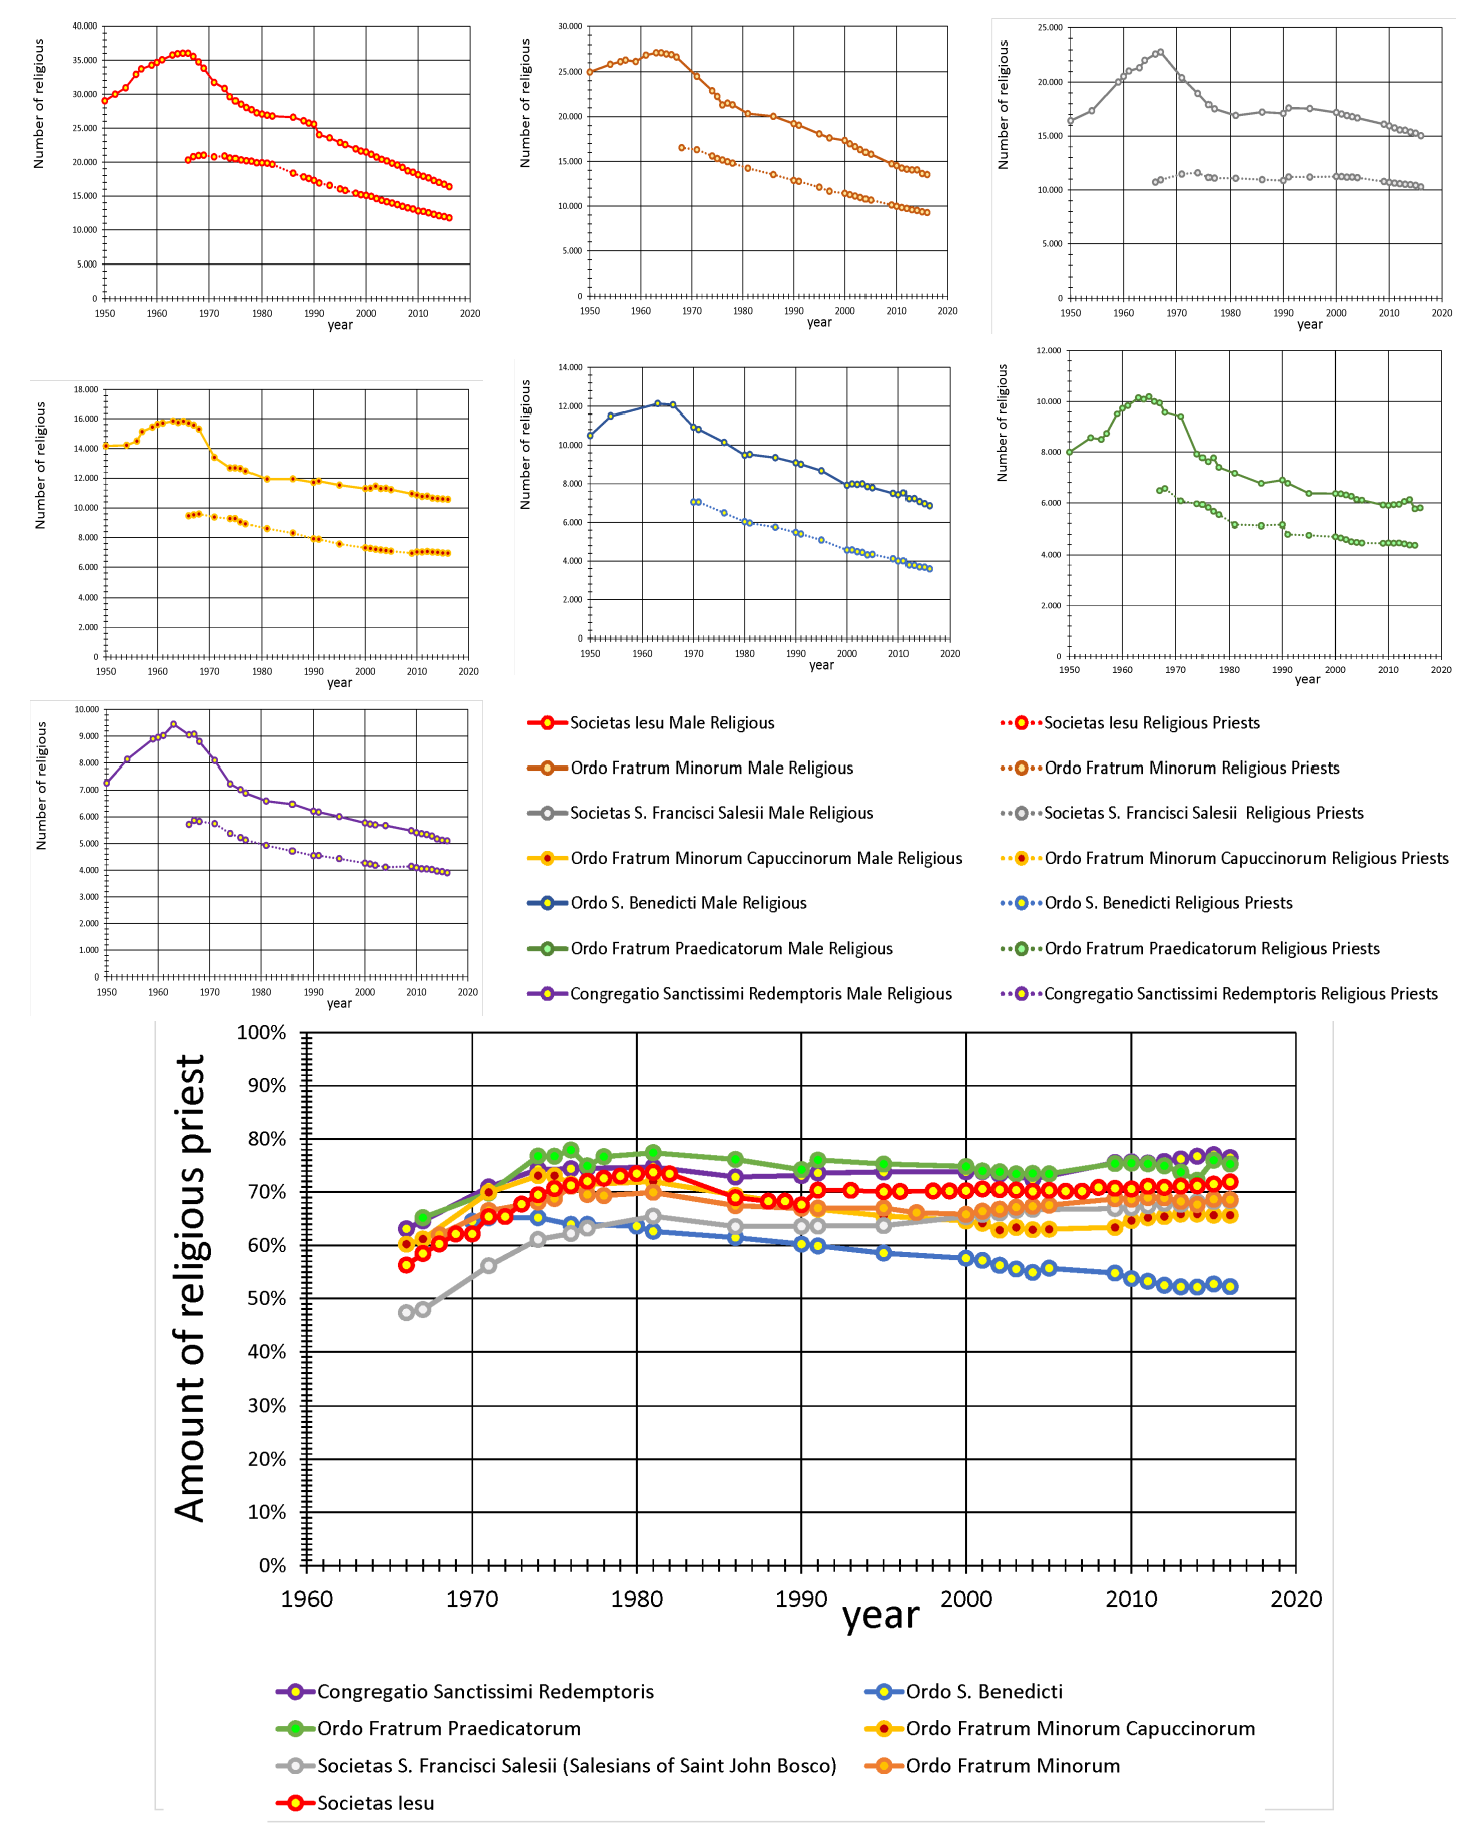
First, regarding the data used for the timelines for the 134 well-documented congregations provided by 'The Hierarchy of the Catholic Church' [1] two datasets has been checked by a comparison to data found at various repositories, like the Jesuits (Figure 8) and the Salesian (Figure 9) [20], [21].
Second, since institutes are grouped and compared relatively according to similar timelines, data for a single religious of a smaller institute has a greater influence on the relative data in percentages than data for a single religious of a larger institute. As an example, a change for a single religious in a congregation consisting of 25 members can make for a 4% change on the timeline. This is why there is a wide scattering for some of the small congregations on the timeline.
![Figure 8: Comparison data concerning the Jesuits [1], [20]](http://www.ecclesiadei.nl/plaatjes/fruits_1/image014a.png)
![Figure 9: Comparison data concerning the Salesians of Don Bosco [1], [21]](http://www.ecclesiadei.nl/plaatjes/fruits_1/image014b.png)
Third, it must be taken into consideration that especially regarding the smaller institutes, the influence of a single charismatic leader can be very strong. If any such charismatic leader should fall away for any reason, it can have a dramatic effect on the timeline.
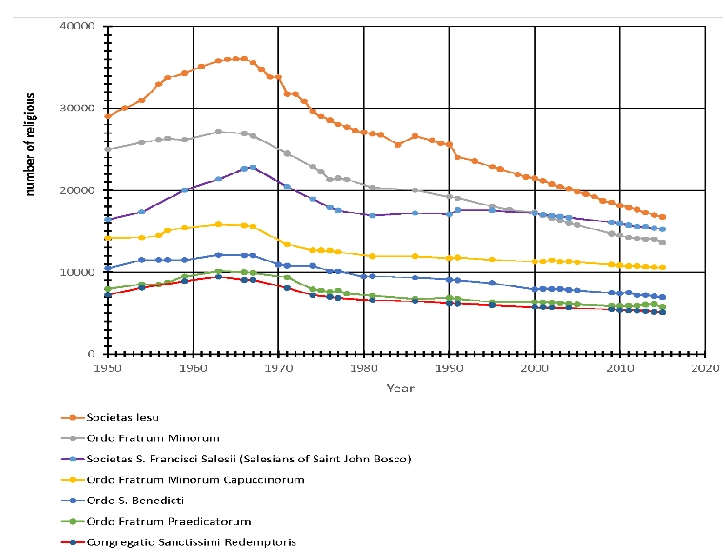
Fourth,the seven largest institutes (Jesuits, Franciscans, Salesians, Capuchins, Benedictines, Dominicans and Redemptorists) make up about 39.5% of all religious in 2014. Because such a large number of religious are represented by these seven institutes, their trends strongly influence the average results for all institutes. While the average decline of 110 Institutes of Consecrated Life is 37.2%, the average decline of these Institutes can be estimated at about 43%, while the decline of the Jesuits and Franciscans is 52.8% and 48.2% respectively (Figure 10).
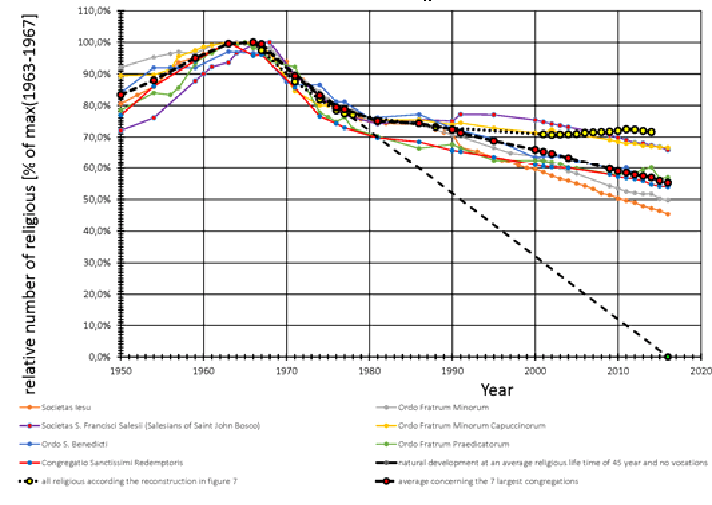
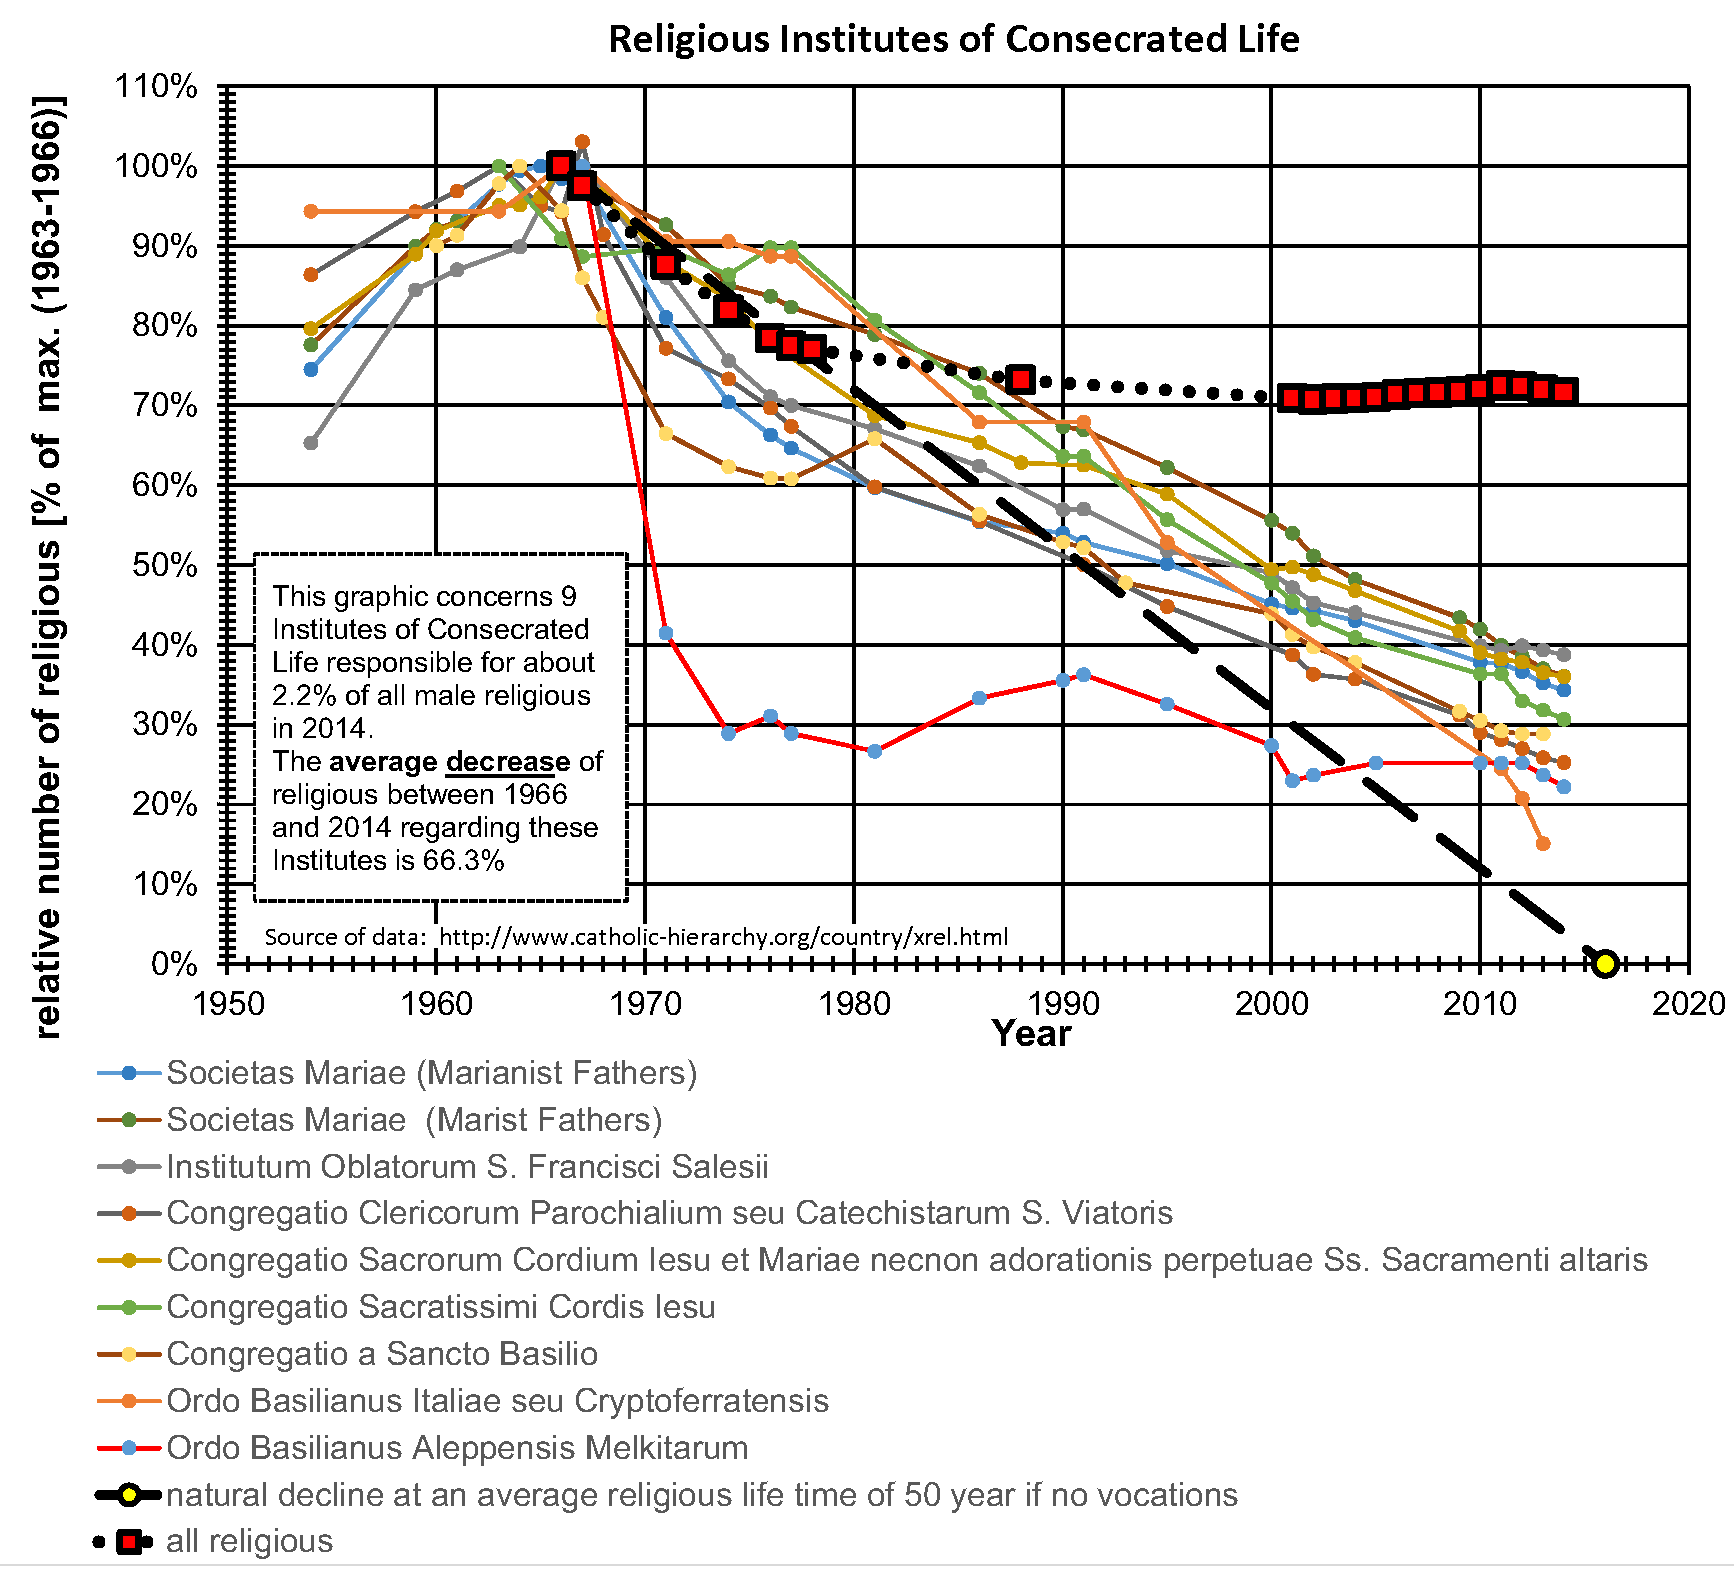
Fifth, it should be noted that Figure 11 to Figure 17 contain two reference curves, one that is black dashed and the other that is black dotted:
black dashed curve represents the average natural decline with an estimated religious life time of 50 years if there are no vocations. Declines that are structurally steeper than this curve indicate a situation where the number of resignations or losses exceeds the number of vocations. A vocation rate of 2%/year, which corresponds to an inspiration of 1 vocation per religious within his religious lifetime, is needed to keep a constant number of religious. - The black dotted curv represents the average developments of all religious as reconstructed in Figure 7. During the first seven years after Vatican II this curve shows a little more decline than the black dashed curve of the natural decline (-2.25%/year). From between 1974 to 1976 a small decrease of the declining rate (-2.0%/year) can be observed that leads to a more moderate decline between 1976 and 2004 (from -0.8 %/year to -0.2%/year). Hereafter during a period of 8 years, from 2004 to 2012 the number of religious was stabilized and shows even a small increase (+0.25 %/year). However, during the period from 2012 to 2014 the Church has been confronted again with a declining of the number of religious (-0.5%/year).
4.1 Institutes Grouped According to Characteristic Timelines
While Figure 6 shows the timelines of 67 Institutes of Consecrated Life that have been distinguished here into the categories 1 to 5 (Figure 11 to Figure 16)
4.1.1 Category 1: Institutes in Severe Decline
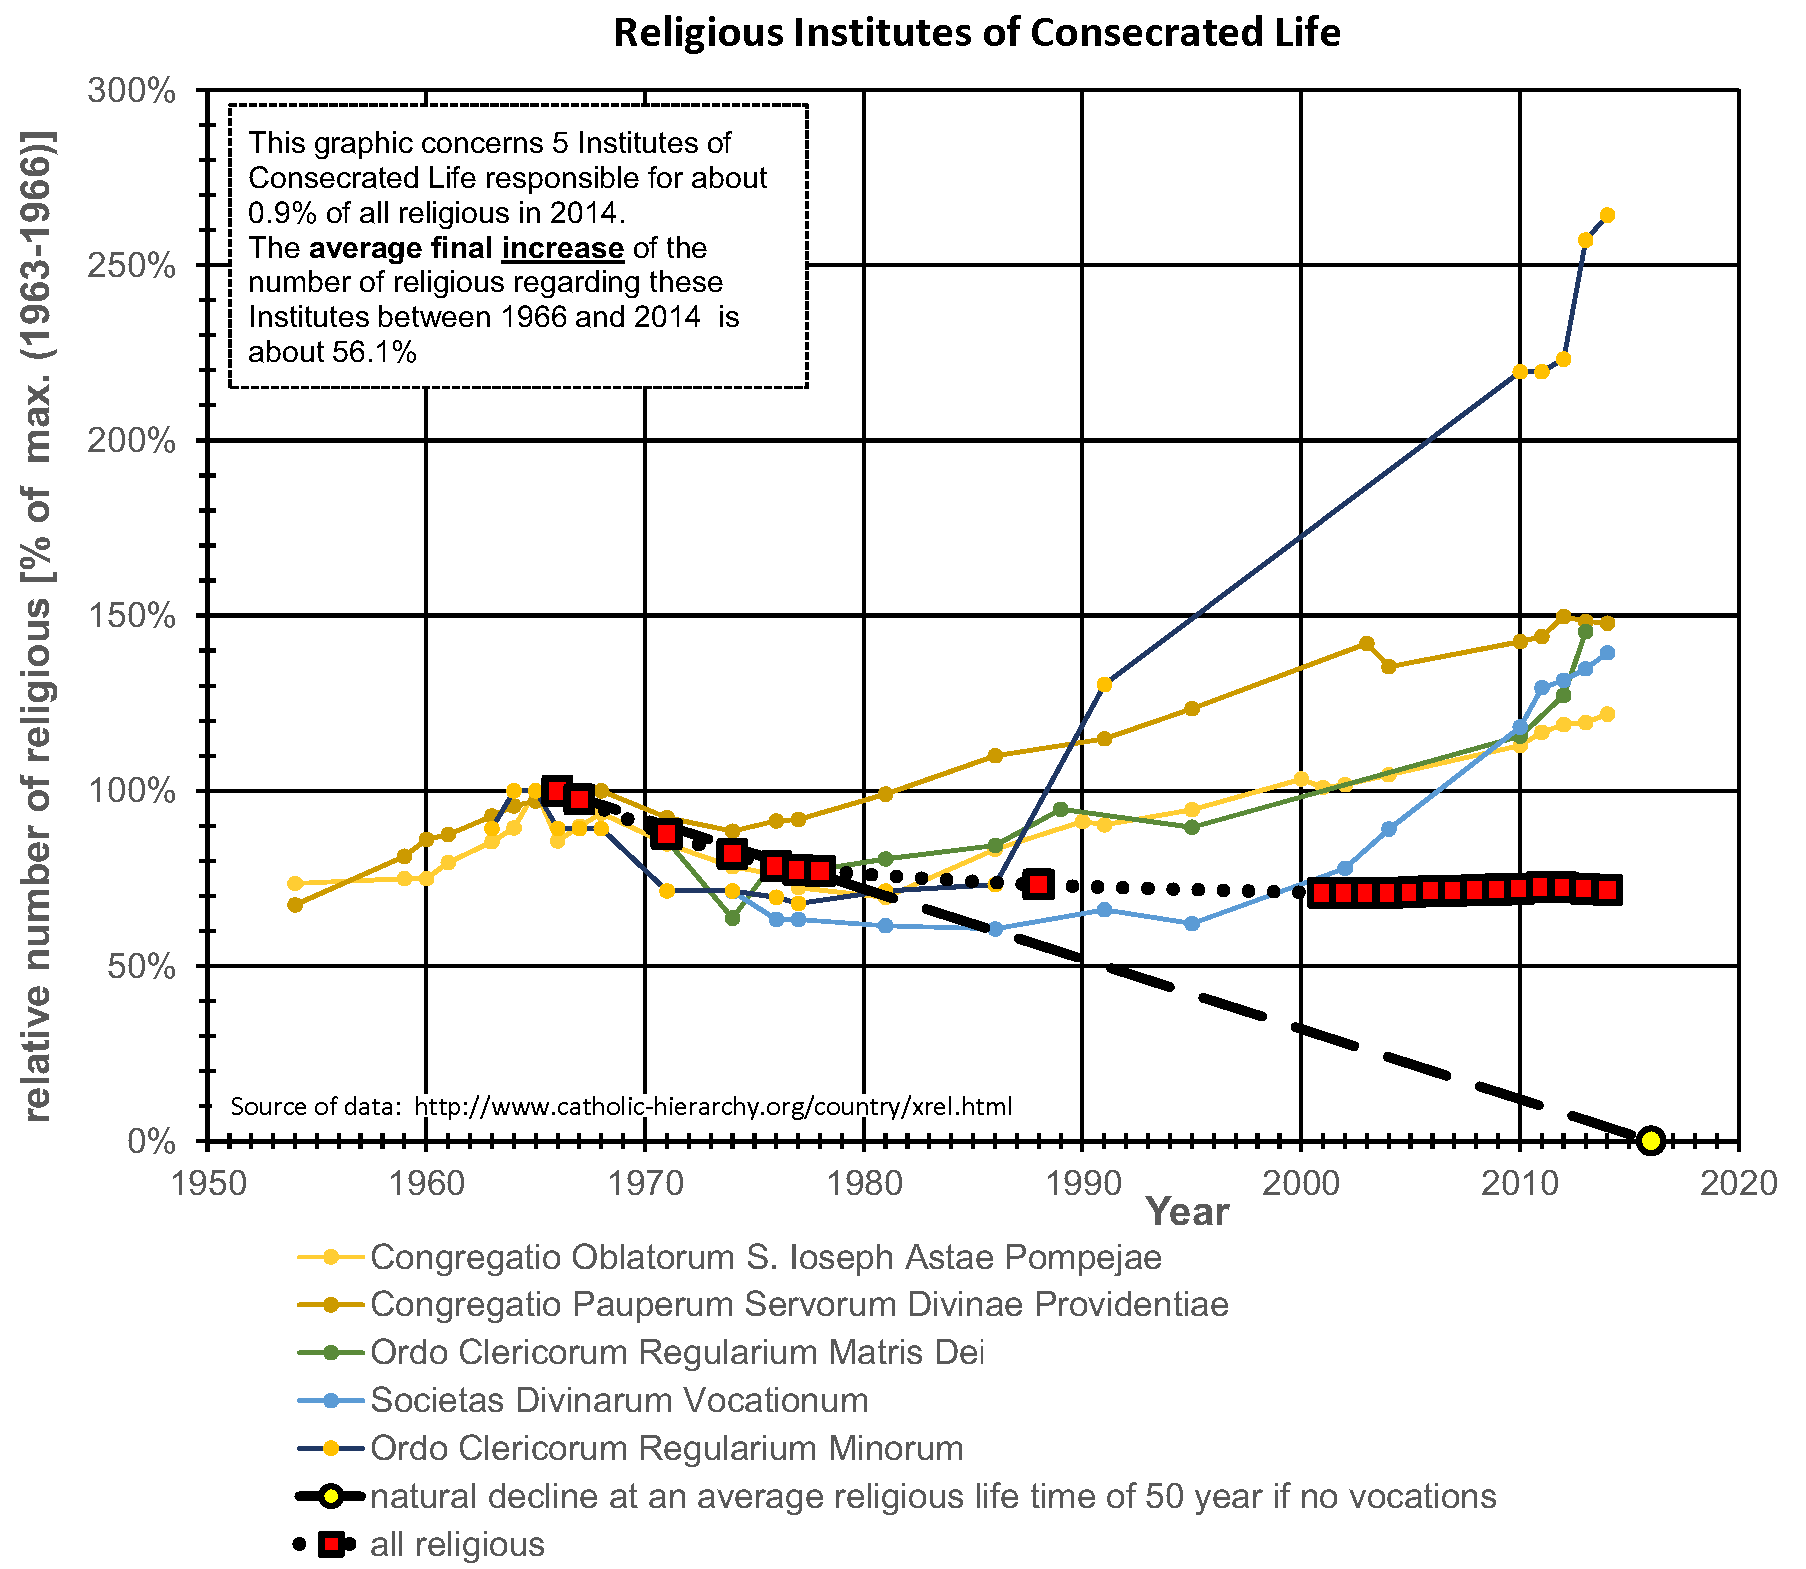
Figure 11 and Figure 12 concern 39 and 7 institutes representing respectively 74.2% and 4.7% of the religious represented by the 110 institutes in 1966. In 2014, they represented 63.1% and 2.4% of the religious. Both figures show an initial severe decline during the first decade after Vatican II, and then, around 1975-1976, a moderation of the declining rate. All of them continue to decline until the latest available data obtained for 2014. Figure 12 shows a more extreme decline then the institutes in Figure 11.
Figure 11 includes all large institutes such as Jesuits, Franciscans, Salesians, Benedictines and Dominicans. The timelines of the two largest institutes, Jesuits and Franciscans, are highlighted in Figure 6 and Figure 11. These two institutes together represent 24% of the 110 religious Institutes of Consecrated Life in 1966 and 19% of these religious in 2014 and have therefore a tremendous influence on the average timeline curve. Remarkably, the timelines of the Jesuits and the Franciscans followed the average curve very well until about 1985. After 1985, the timelines of these institutes diverge from the average by an increase of the declining rate to about -1%/year. While the average decline of all these religious in 2014 is about 38.1% of their high point, the decline of these two institutes, Jesuits and Franciscans, have been reduced by 2014 to about 46.5% and 51.8% of the number of religious in 1966, and the decline continues.
This category includes the Benedictines, within which there is not a universal decline. Notable exceptions would be the foundation at Fontgombault and the more recent daughter houses at Barroux and Clear Creek. Our Lady of the Annunciation at Clear Creek, Oklahoma, was founded in 2000 with 12 monks and now has over fifty, with at least a handful of teenage monks at any given time. So, while they are a part of the larger "Benedictines" of Category 1, by themselves they would belong in another category.
The diversity of institutes in this category is quite alarming. From the reclusive and contemplative Carthusian Congregation (Ordo Cartusiensis), known for its strictness and adherence to Gregorian chant, to the Jesuits (Societas Jesu), with their emphasis on scholarship and evangelism, there are almost no ties between these organizations besides the fact that they all suffered a steady, observable decline after Vatican II. This prevents one from speculating on a cause other than Vatican II itself, since each of these congregations, in their own way, responded to the canonical reforms and underwent internal changes.
| Figure 11: Institutes in Severe Decline | Figure 12: Institutes in Severe and Extreme Decline |
 |
 |
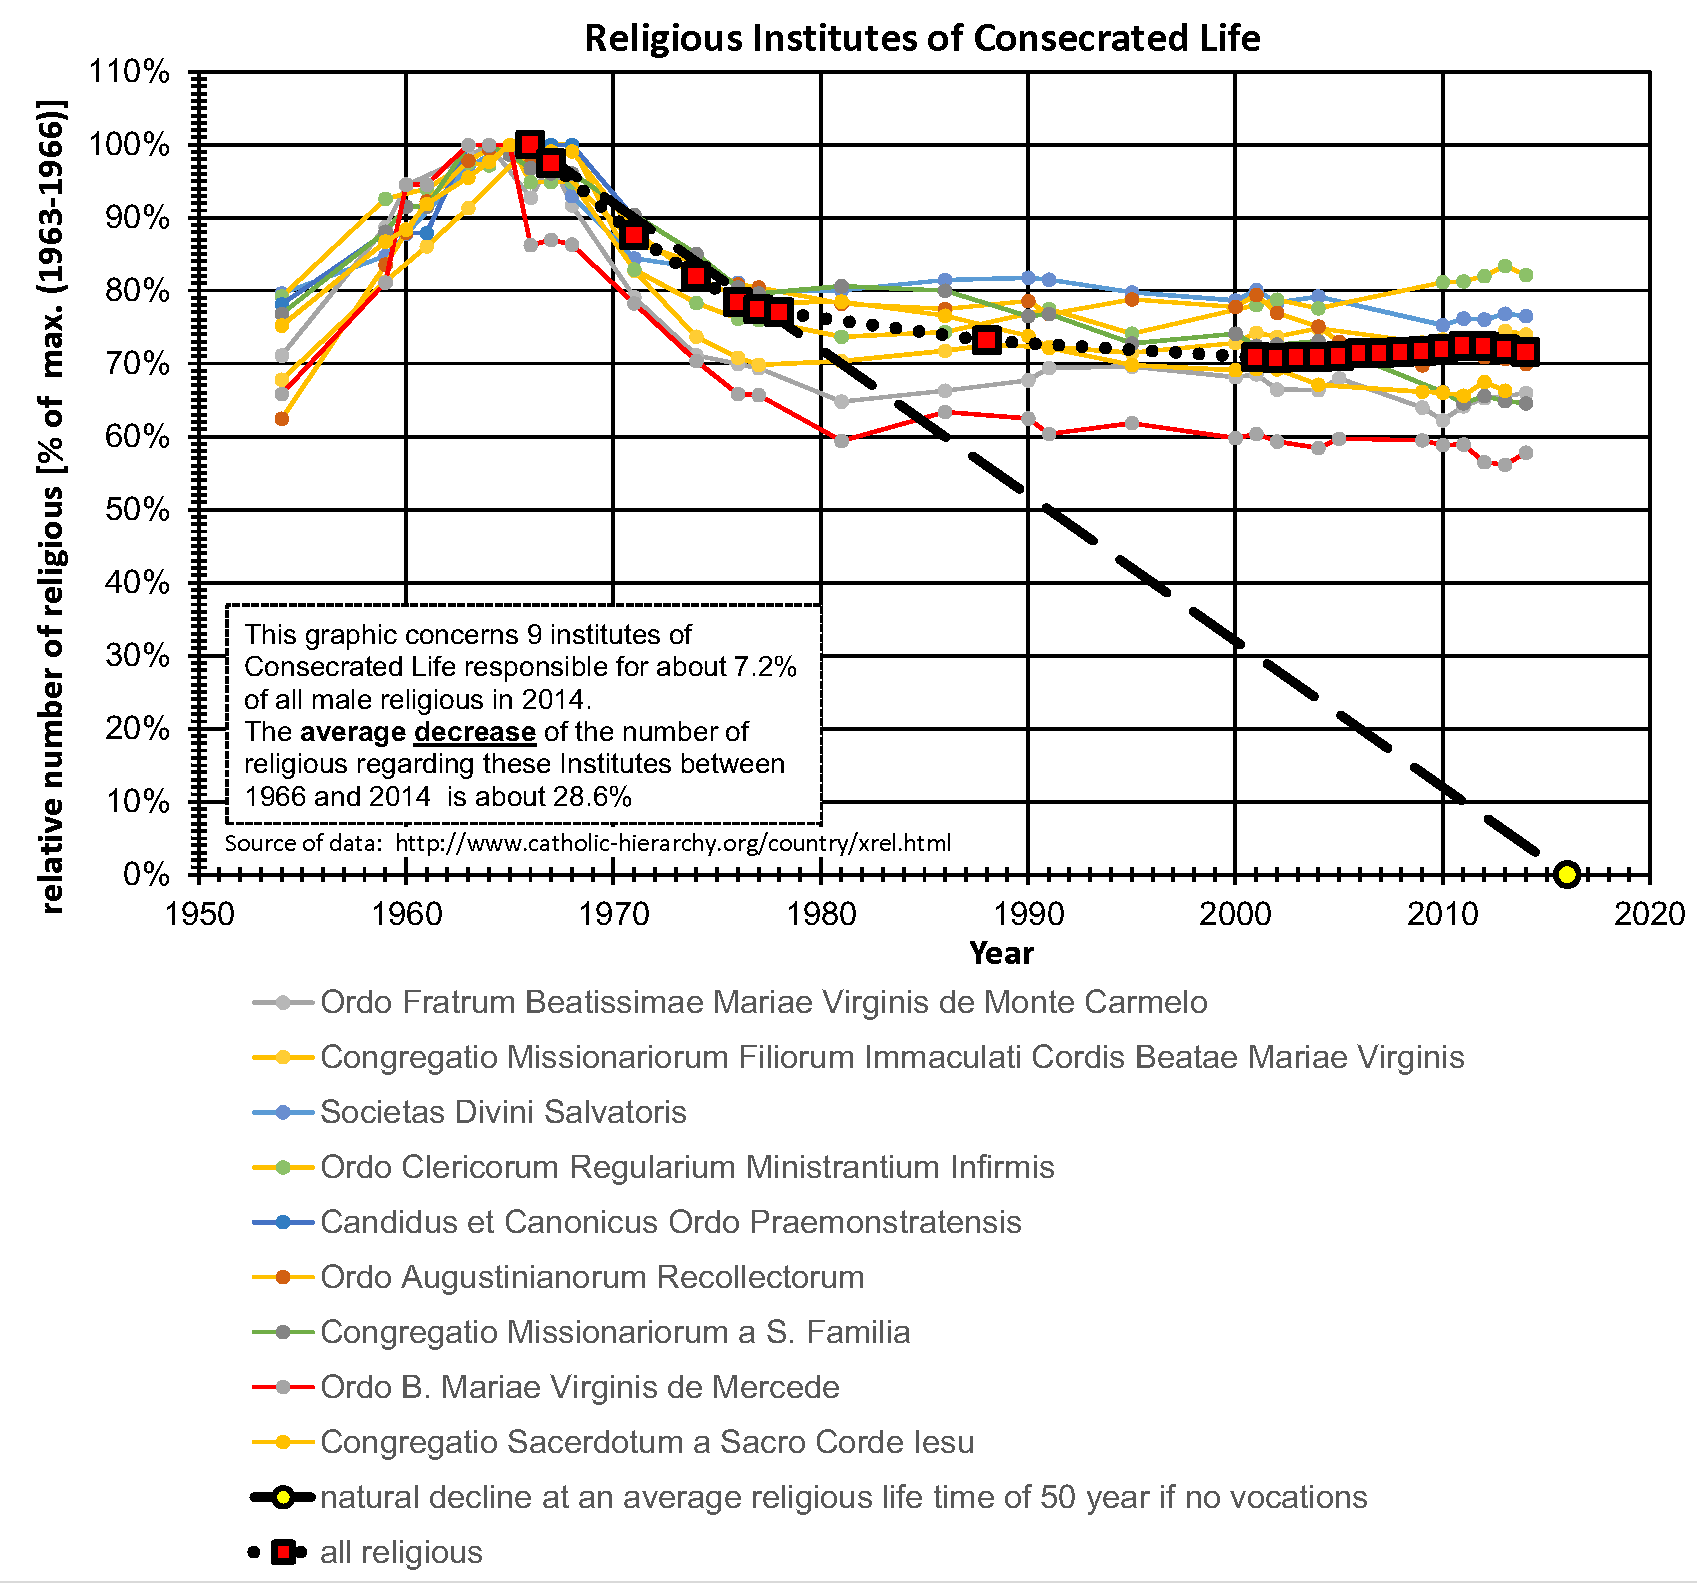
4.1.2 Category 2: Institutes in Decline but Eventually Finding Stability
In contrast with Figure 11 and Figure 12, the 9 institutes in Figure 13 exhibit, after the initial post-Vatican II decline a period of stability beginning about 1980. These 9 clustered institutes represent about 7.4% of the religious of the 110 Institutes of Consecrated Life in 1966. Due to the decline of the total number of religious, this representation rose to 8.8% of these religious in 2014. Compared with the dramatic decline of the Institutes isolated in the Figure 11 and Figure 12, the institutes of Figure 13 manifest a relative growth for the period after 1976.
Considering the nine institutes depicted in Figure 13, while it may be difficult to find a unifying feature among them, nonetheless, taken individually, some of them offer some tantalizing clues as to why they achieved stability.
The Salvatorians (Societas Divini Salvatoris), for example, are engaged in parish, school, and missionary work [22], which would suggest that they have ample access to young people considering a possible vocation to religious or consecrated life.
The same could be said for the Mercedarians (Ordo B. Mariae Virginis de Mercede) who, like the Salvatorians, have a strong presence in teen ministry through the Lifeteen program and parish ministry [23]. It is worth mentioning that this congregation maintains the wearing of the habit and a full community life of prayer in addition to their external ministries.
| Figure 13: Institutes in Decline but Eventually Finding Stability | Figure 14: Institutes in Decline but Eventually Reaching Slow Rate of Growth |
 |
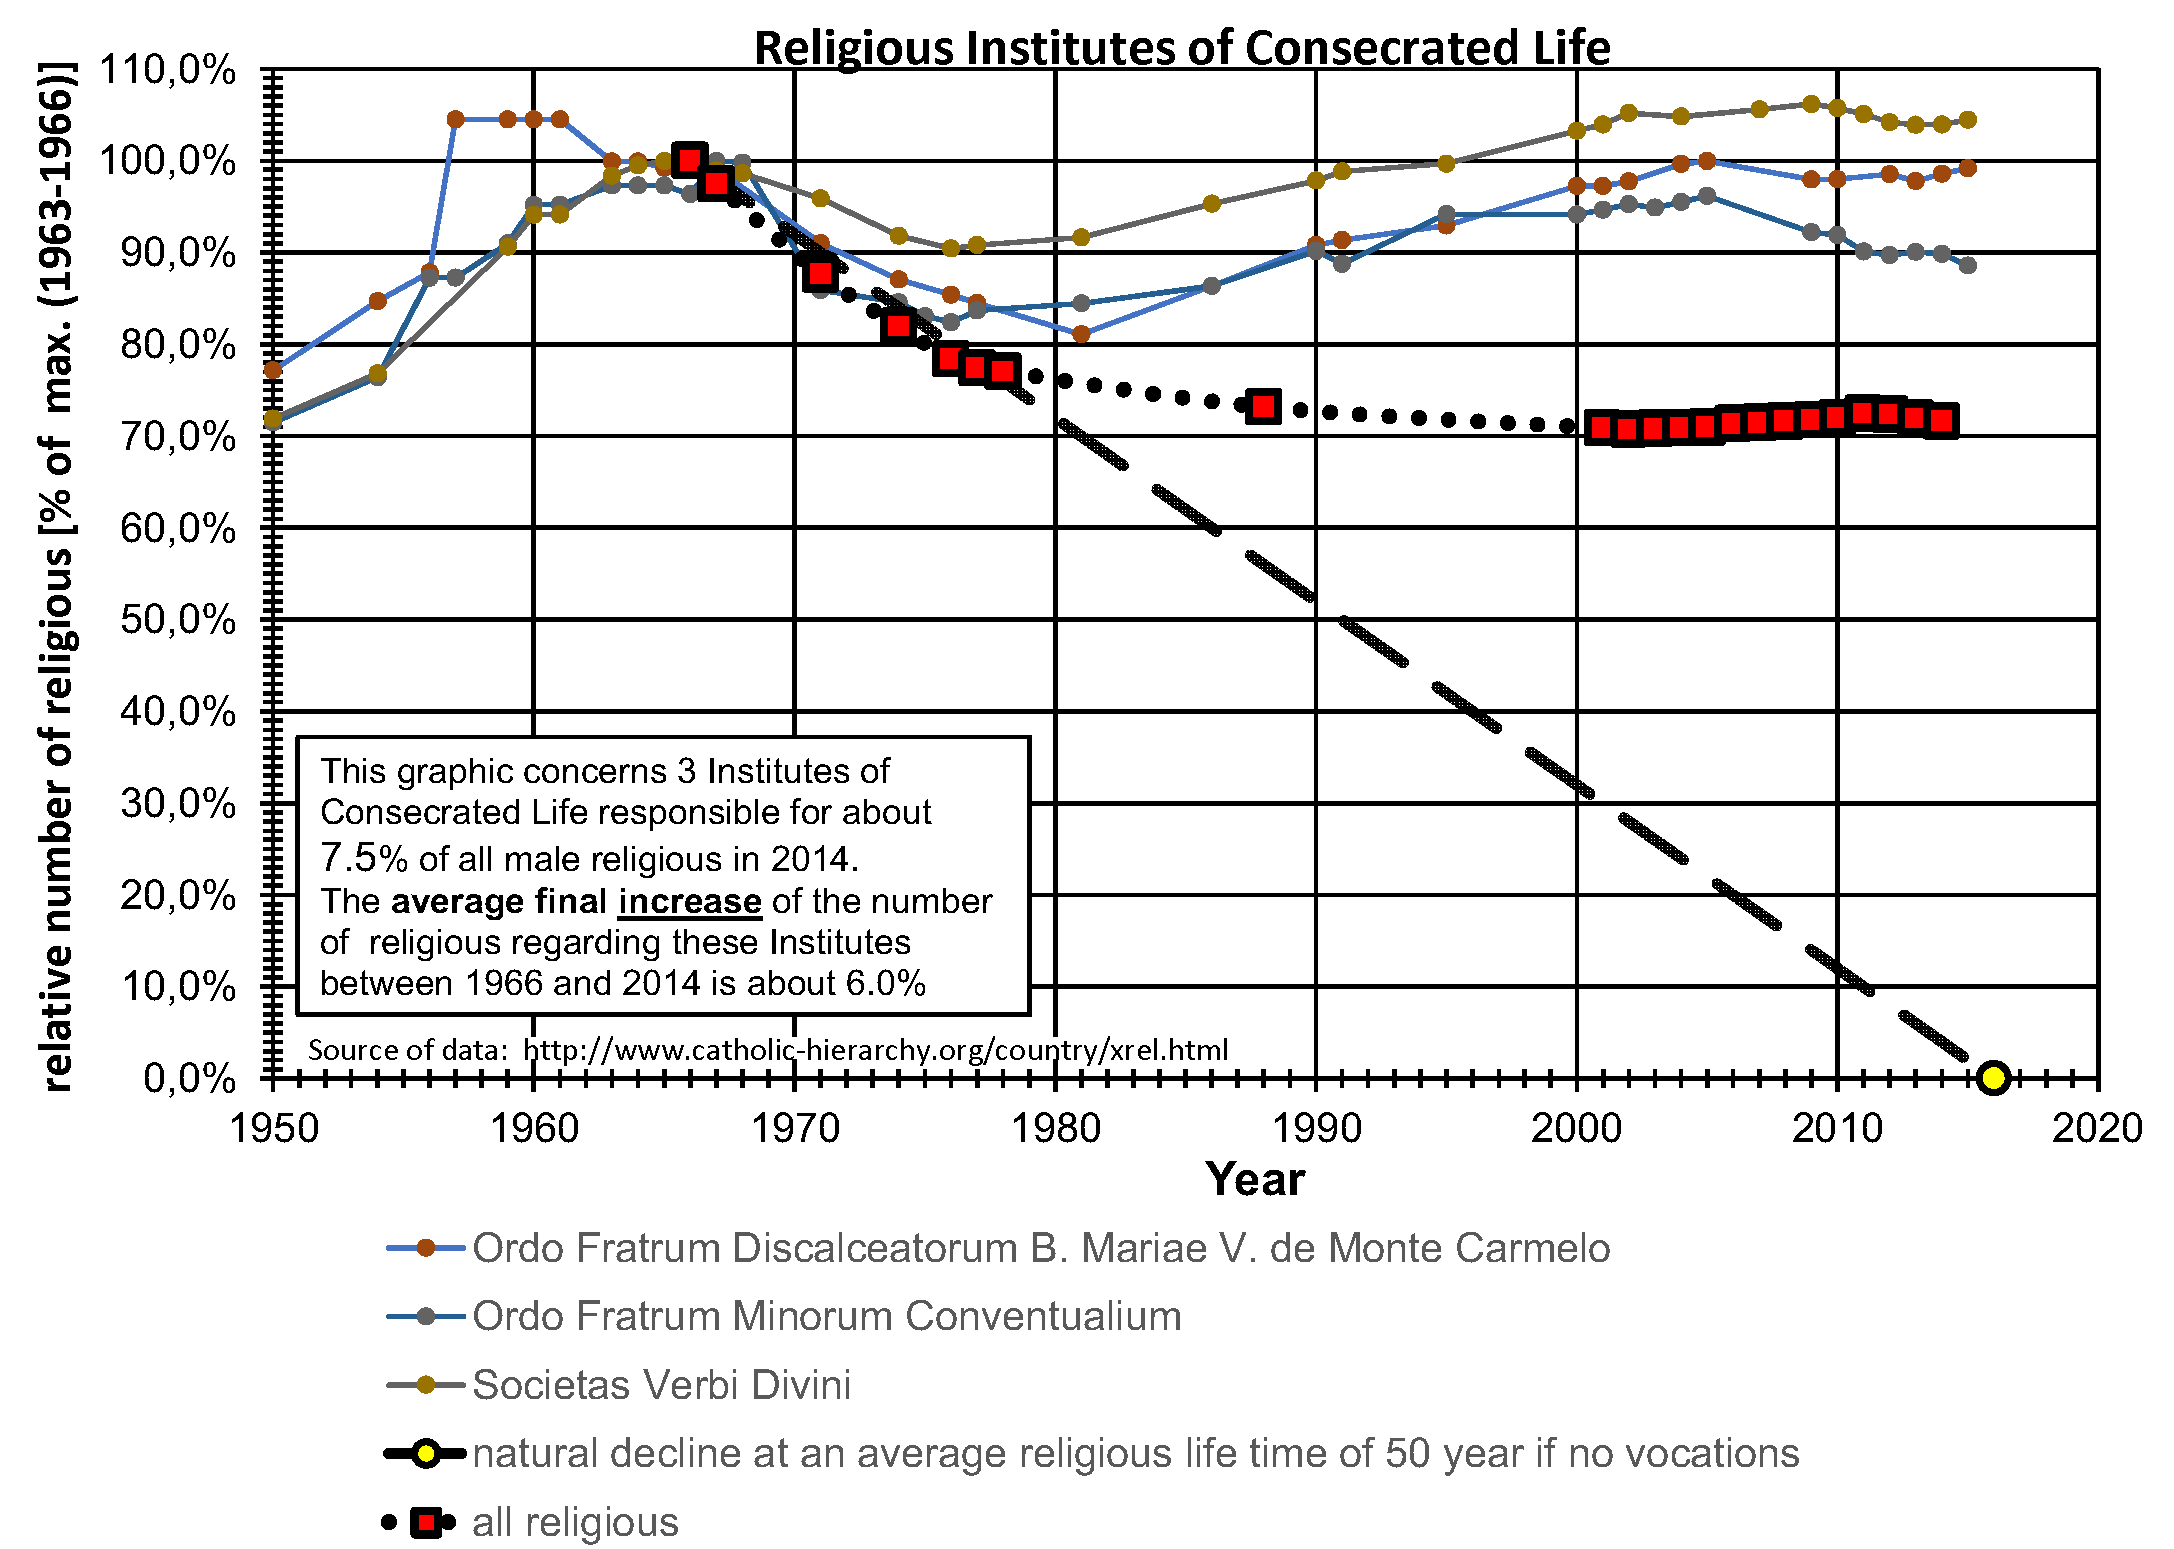 |
4.1.3 Category 3: Institutes in Decline but Eventually Reaching a Slow Rate of Growth
Figure 14 depicts timelines of 3 institutes only representing about 5.2% of the religious of Consecrated Life in 1966 and 8.4% of the religious in 2014. After the post Vatican II decline of the first decade, these institutes stabilized and began to grow at a rate sufficient to reach a rather constant membership in 2000. Then, after 2000, two of these institutes seem to stabilize at that level, while the other one decreases again.
Franciscans (Ordo Fratrum Minorum Conventualium) are well known for their parish ministry in several shrines and basilicas. They, like the Mercedarians, maintain the use of the habit on a regular basis and may, therefore, attract many vocations among the people to whom they minister.
The Society of the Divine Word (Societas Verbi Divini) is a somewhat different creature. While its members are certainly engaged in parish ministry, they are not usually assigned in larger groups or communities like the other houses that have been mentioned previously. Nonetheless, they share with them a focus on missionary work, especially in growing areas of the Church such as Africa, Latin America, and Oceania [24 ]. Along with this, they have a significant lay missionary program, all of which suggest a certain visibility to possible discerners.
4.1.4 Category 4: Institutes Eventually Restoring Pre-1965 Membership Level
Figure 15 shows a very remarkable development of the timelines of 6 institutes representing only 0.8% of the mentioned religious in 1966 and 1.6% in 2014. After the decrease of the number of religious in the first decade for some of these institutes, even to about 50%, they increased rather rapidly by an increasing rate of 2.5%/year until growth had reached a level of about 115% relative to the 1966 numbers. Then after reaching that maximum a sudden decline occurred similar to the average rate of decline.
| Figure 15: Institutes Eventually Restoring Pre-1965 Membership Level | Figure 16: Institutes Eventually Restoring Pre-1965 Rate of Growth |
 |
 |
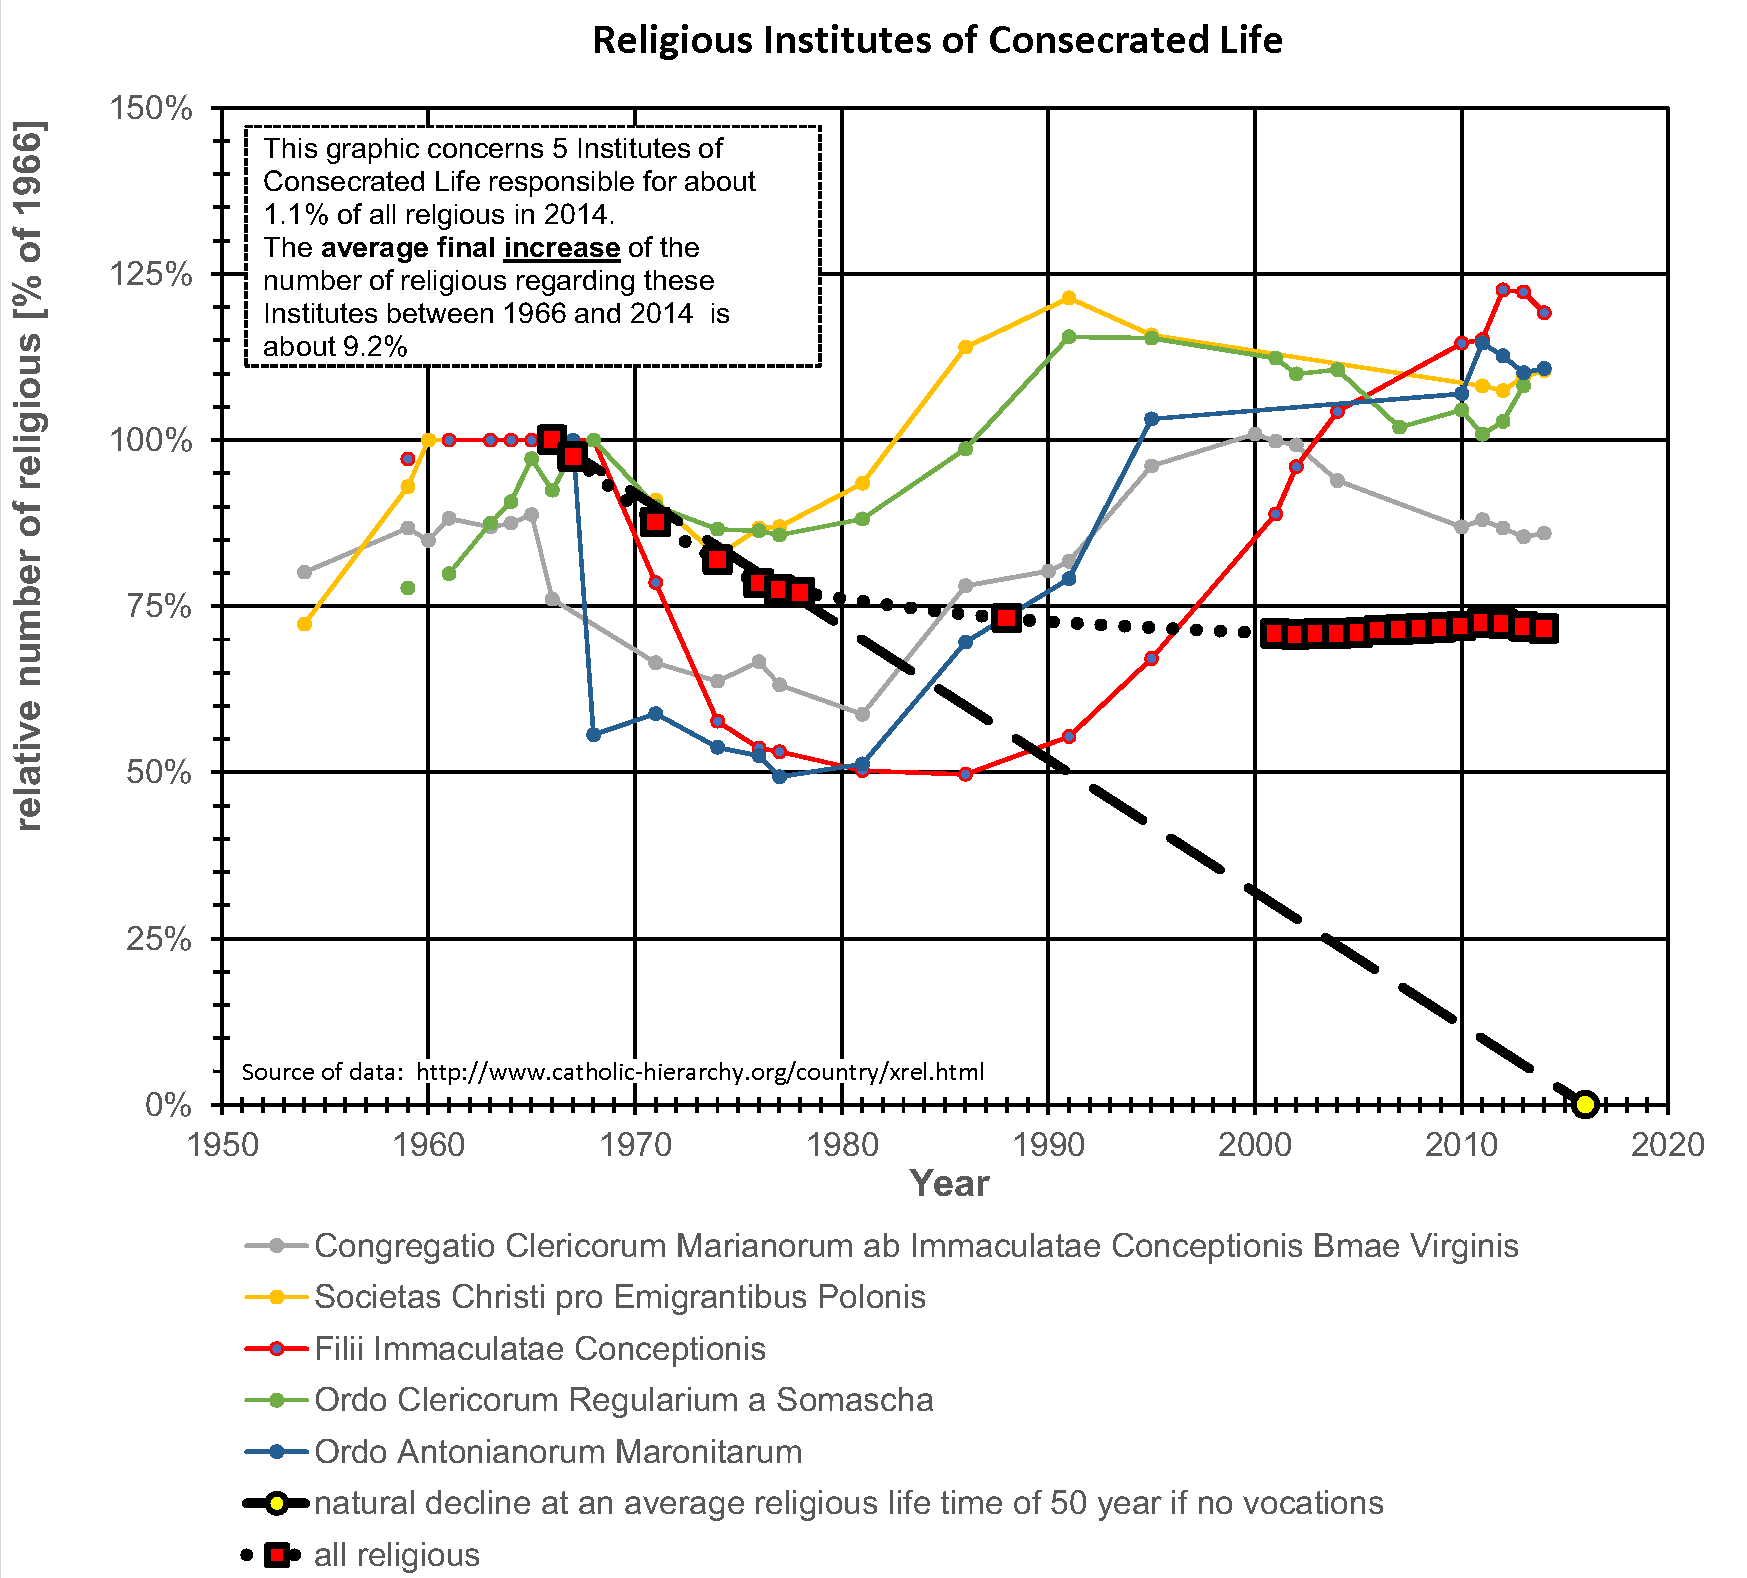
4.1.5 Category 5: Institutes Eventually Restoring Pre-1965 Rate of Growth
Figure 16 concerns a cluster of 3 institutes representing 0.3% of these religious of Consecrated Life in 1966 and 0.6% in 2014. The timelines of these institutes show a development of the number of their religious after a more moderate post Vatican II decline in the first decade leading up to 2014. These institutes have grown to about 140% to 150% of the number of religious they had in 1966.
One thing to be noticed about these organizations is their strong association with nationalities outside of Western Europe. In the case of the Societas Christi pro Emigrantibus Polonis (The Society of Christ for Polish Emigrants), for example, a congregation specifically designated for the care of the Polish, it flourished during a period of time presided over by a Polish pope. This is not particularly surprising. It is notable that their most profound period of growth happened at the height of the papacy of St. John Paul II. At the same time the Ordo Antonianorum Maronitarum, a congregation attached to the Maronite Rite, which maintains most of its traditional ritual, shows continual growth, which suggests a growth in congregations attached to a more conservative liturgical tradition. In all, the well-known reforms that were implemented so vigorously in the West seem mainly to have benefited Churches in the East that did not change their Holy Liturgy.
4.1.6 Category 6: Institutes suffering no post-1965 Decline
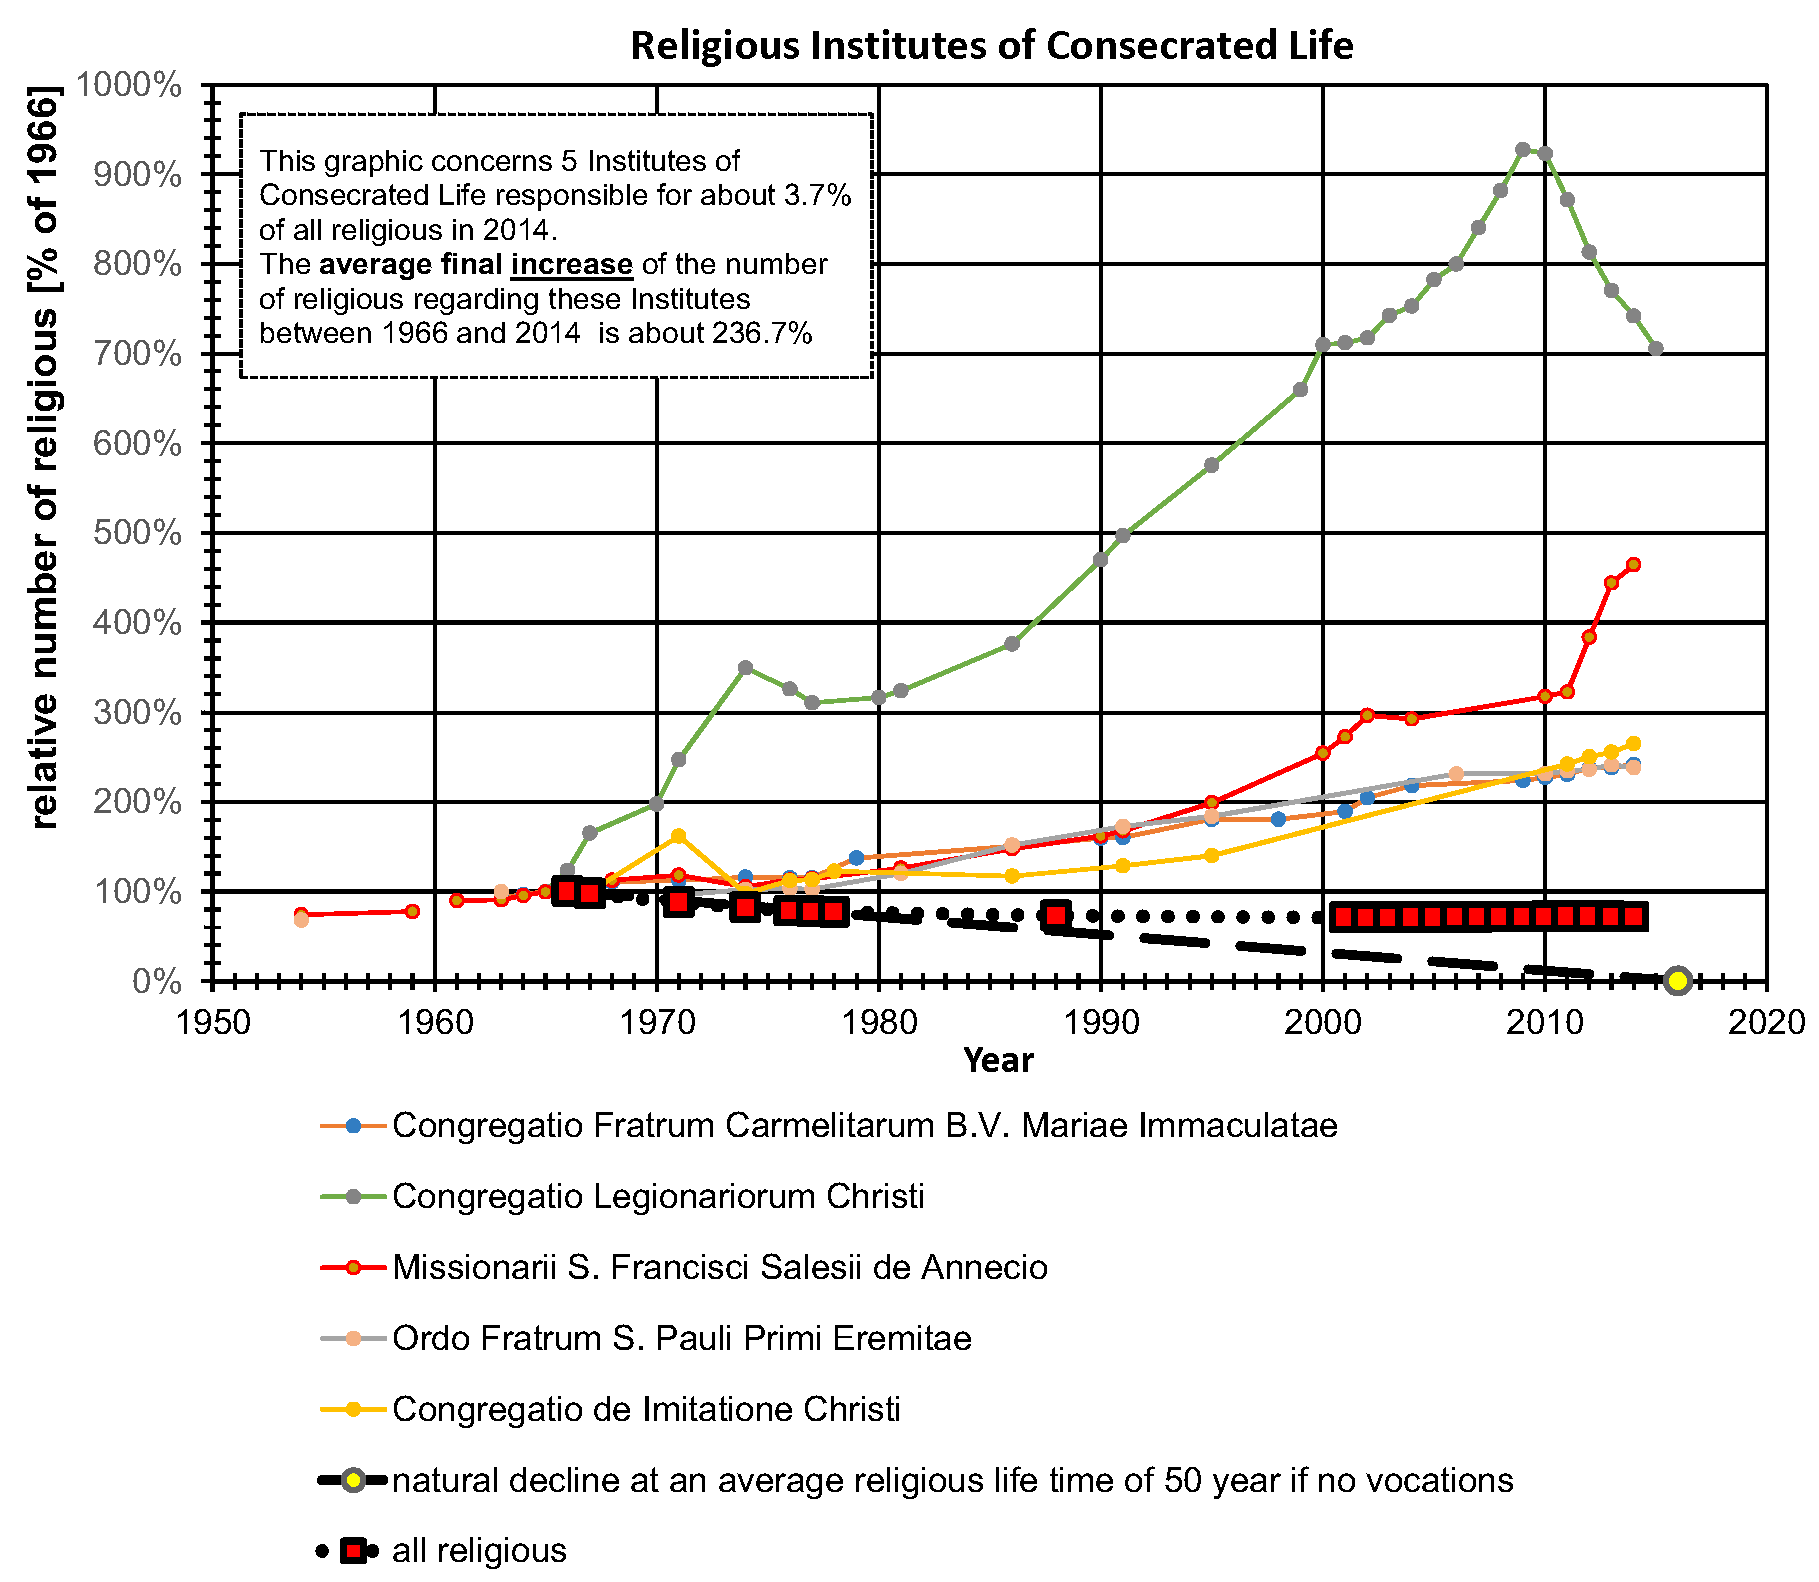
Figure 17 shows 6 institutes representing in 1966 only 0.8% of the religious but in 2014 these institutes has been increased up to 4.3% of the mentioned religious, partly due to the average decline but also due to the increase of the number of religious of these institutes themselves. Evidently these institutes were not subjected to the post Vatican II decline during the first decade after Vatican II. While one of these institutes made a remarkable increase of the number of religious up to about 750% in 2009, the other institutes grew to about 250% to 300% relative to their numbers in 1966.
It has to be commented that this analysis also marks irregularities that can be caused by specific events. Such can be seen in Figure 17 by timeline of the 'Congregatio Legionariorum Christi' that shows a sudden collapse after a strong growth of the Institute, where due to some internal problems, a strong decrease can be observed that is much sharper than a free fall without vocations. However, it can also be observed that some other institutes seem to have derived some benefit from this event by a sudden increase in the number of their religious, such as perhaps the 'Missionarii S. Francisci Salesii de Annecio'
| Figure 17: Institutes Suffering no Post-1965 Decline | Figure 18: Institutes founded after 1966 |
 |
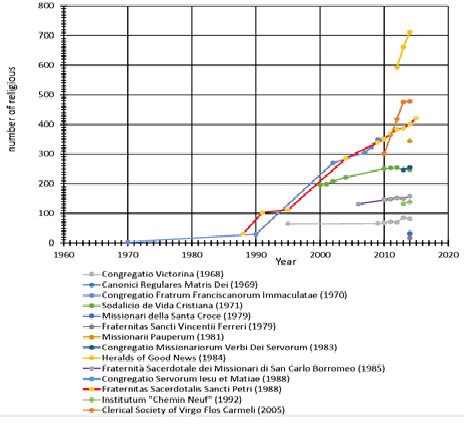 |
4.1.7 Category 7: Institutes founded after 1966
Figure 18 gives the timelines in absolute values for both 8 Institutes of Consecrated Life and 6 Societies for Apostolic Life that have been founded after the Second Vatican Council. The membership of these institutes cannot be expressed in relative values regarding a maximum number of religious during the period of the Council. In 2014 these 14 religious congregations represent about 1.6% of all religious.
5 Analysis
Despite the fact that this report contains objective facts and statistical analysis and is therefore of quantitative character, the numbers still bear out the words of Our Lord:
"By their fruits you shall know them. Do men
gather grapes of thorns, or figs of thistles? Even so every good tree bringeth
forth good fruit, and the evil tree bringeth forth evil fruit. A good tree
cannot bring forth evil fruit, neither can an evil tree bring forth good
fruit. Every tree that bringeth not forth good fruit, shall be cut down, and
shall be cast into the fire. Wherefore by their fruits you shall know them."
(Matt. 7, 16-20).
The quantitative analysis that we have given provides an indication of the quality of the spiritual nature of religious congregations and the religious themselves. The reason for this is that vocations are the primary spiritual fruit of a congregation. Moreover, these figures can also be an objective way to distinguish the work of the spirit of the world from the work of the Holy Spirit in the modern Church, for the Holy Spirit cannot be responsible for a long term continued decline of a congregation.
5.1 Period from 1950 to 1976
The statistical data above vividly depicts the dramatic decline of the number of male religious in the post-Conciliar period. After having begun some time between 1963 and 1966, this decline continues to the present for most religious congregations. For 134 well-documented religious congregations that still represent about 74% of all religious in 2014, the average decline within the first decade after the Council was about 20%, from 281,484 religious in 1966 to about 226,676 in 1976 (Table 4). Only 5 of the 134 previously mentioned congregations did not suffer that first decade post-Council decline (Figure 17).
It appears in Figure 6 that, for several religious congregations, the decline in 1976 varied between 10% to even 50% with an average of about 20%. That means a variation of declining rate between about -1%/year to -5%/year with an average of about -2%/year. In contrast to this sudden decline after the Second Vatican Council, the data shows that there was a preconciliar growth rate that varied between +1%/year and +2%/year during the period 1950 to 1963. The same can be found by other sources regarding some of the religious institutes, such as the Society of Jesus (Figure 8) and the Salesians of Don Bosco (Figure 9).
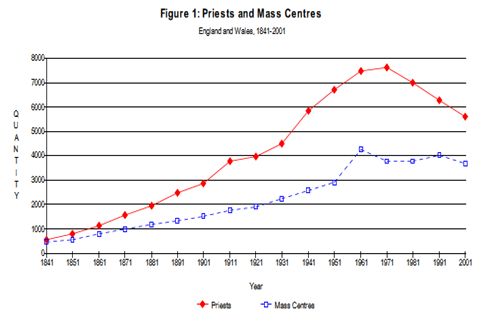
This was also true for the diocesan clergy in the Netherlands (Figure 2 to Figure 4), the USA (Figure 19) and Great Britain (Figure 20, England and Wales [23]). These data indicate that this growth rate was not only during the last decade before the Second Vatican Council but had been a reality for several decades before this sudden decline that began between 1963 and 1966.
The data pertaining to the Dutch ordinations (Figure 2) as well as the number of clergy in England and Wales (Figure 20) do not show any decline of religious membership after the First Vatican Council. The Salesians of Don Bosco (Figure 9), founded in 1859, showed for all years through till 1966 a steady growth from about zero in 1859 to 22,810 in 1966, an average growth of about 210 vocation a year.
| Figure 19: Number of clergy in USA [6] | Figure 20: Number of clergy in England and Wales [23 ] |
![Figure 19: Number of clergy in USA [6]](http://www.ecclesiadei.nl/plaatjes/fruits_1/image024.png) |
 |
| Table 5: Turning point from growth before 1963 to decline after 1966 regarding the largest congregations [1] |
![Table 5: Turning point from growth before 1963 to decline after 1966 regarding the largest congregations [1]](http://www.ecclesiadei.nl/plaatjes/fruits_1/image027.png) |
| Figure 21: Number of faithful per priest in USA | Figure 22: ReligiousSisters in US (1943-2012) [20] |
 |
![Figure 22: ReligiousSisters in US (1943-2012) [20]](http://www.ecclesiadei.nl/plaatjes/fruits_1/image028.png) |
Table 5 shows the radical shift from apattern of growth prior to 1963 into a dramatic decline after 1966.
Some of the sources also show that, before 1963, the growth of the number of clergy for decades was linear, coinciding with the growth of the number of faithful ( Figure 4 and Figure 23).
As was previously observed in the Dutch example (Figure 2 to Figure 4), the reversal of a growth rate to a declining rate can only be explained by a sudden and dramatic drop of vocations together with a dramatic increase of resignations. The declining rate is generally a result of a combination of lost vocations, resignation and the natural decrease by dying members. Based on an estimated religious life time of 50 years, the latter can be estimated as -2%/year. It has to be concluded that, if the declining rate goes beyond -2%/year, it must be due to resignations.
At this point the following questions can be raised:
Why this Church-wide sudden lack of ordinations?
Why this Church-wide sudden and dramatic increase in resignations?
Why this Church-wide sudden lack of ordinations?
Why this Church-wide sudden and dramatic increase in resignations?
5.2 Period From 1976 to 2014
| Figure 23: World population and baptized Catholics [3] |
![Figure 23: World population and baptized Catholics [3]](http://www.ecclesiadei.nl/plaatjes/fruits_1/image029.png)
|
- Category 1: Institutes in Severe Decline (Figure 11andFigure 12);
- Category 2: Institutes in Decline but Eventually Finding Stability (Figure 13);
- Category 3: Institutes in Decline but Eventually Reaching a Slow Rate of Growth (Figure 14);
- Category 4: Institutes Eventually Restoring Pre-1965 Membership Level (Figure 15);
- Category 5: Institutes Eventually Restoring Pre-1965 Rate of Growth (Figure 16);
- Category 6: Institutes suffering no post-1965 Decline (Figure 17);
- Category 7: Institutes founded after 1966 (Figure 18).
These figures are restricted to a selection of 67 Institutes of Consecrated Life of the 134 well-documented congregations, but still representing about 63.7% of all religious in 2014. Regarding this selection, approximately 47.3% of all religious belong to Category 1 (Figure 12 and Figure 13) and continued in decline during the years after 1976, reaching to between 20% and 50% of their 1966 membership in 2014. Five of the largest seven congregations, representing 19% of all religious in 2014, are among these congregations, with a decline varying between about 45% and 55%.
However, in contrast to these congregations in continual decline, the other categories do not show a steady decline. While some of these congregations stabilized around the 1976-level, others show after that initial decline a variant of growth.
Within these particular congregations, the membership levels of categories 2 to 7 compensated for the decline within category 1 so that the average decline of the 134 congregations is about 38%. Taking into account also the 14 previously-mentioned congregations founded after 1966, this decline is reduced to about 37%. Due to the fact that, according the data of Agenzia Fides [3], the total number of religious was rather constant during the last 14 years at an estimated level of about 27.5% compared to 1966 (Figure 24), it can be concluded that a majority of the other congregations, representing about 36.3% of all religious in 2014, contributed to the stabilization of the numbers of religious since about 2000, so that the observed average decline reaches 38%, even though the well-documented congregations slumped to 27.5%.
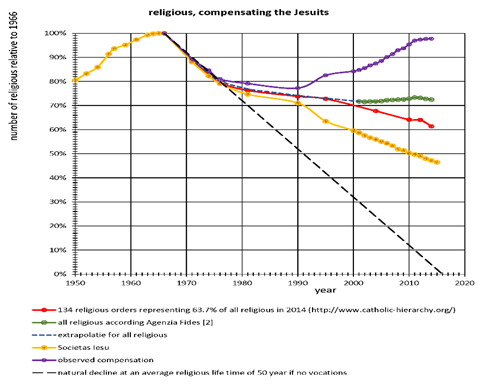
| Figure 24: Compensation of Jesuits' decline |
|
This difference in relative decline means that the decline of the Jesuits was compensated by the growth of a large number of smaller congregations representing about the same number of religious as the Jesuits. This is about 7% of all religious in 2014 (Figure 24). This implies an average growth rate of these congregations of about +1%/year, which is comparable to the period before the Second Vatican Council. Evidently, without such compensation for at least five of the seven largest congregations - ~19% of all religious in 2014 - the number of all religious would have been much less, probably 50% to 55% of the 1966 membership level.
Regarding the average timeline of the 134 well-documented congregations, the decline due to the congregations of Category 1 has already been compensated to an average decline of about 10% from the average level for all religious in 2014 and evidently this 10% has been compensated by the non-documented congregations. Obviously the contours of the constructed time line necessary to compensate the Jesuits decline can be observed by a lot of the congregations.
Here we can raise some additional questions, such as "What kind of spirit has caused such a lack of vocations within the congregations mentioned by category 1?", "What do these religious congregations have in common that this decline has continued still after 1976?", "Why can other congregations grow, even such that they compensated to the losses of the category 1 congregations?" as well as "What are the differences between these types of congregations?"
6 Conclusion
The longer a problem is allowed to continue unchecked, the more difficult it becomes to eventually come to terms with it. By categorizing the various institutes according to characteristic curves, one can find the common traits among those institutes which bear fruit and the common traits among those which bear no fruit. The availability of the data suggesting a link between liturgy and the vitality � or lack thereof � of religious life is not new. Such data has been available for many years now. Herein we have shown that the vitality also relates to the religious life and doctrinal integrity of the various institutes.
At some point the question of wilful ignorance must be raised. Those who "bury their heads in the sand" like an ostrich may do so if they would like to avoid some unpleasant fact or news. For the leadership of the Holy Catholic Church to do so when confronted with an existential crisis is intolerable. Saint Thomas Aquinas says
"It is clear that not every kind of ignorance is the cause of a sin, but that alone which removes the knowledge which would prevent the sinful act. �This may happen on the part of the ignorance itself, because to wit this ignorance is voluntary either directly as when a man wishes of set purpose to be ignorant of certain things that he may sin the more freely; or indirectly as when a man, through stress of work or other occupations, neglects to acquire the knowledge which would restrain him from sin. For such like negligence renders the ignorance itself voluntary and sinful, provided it be about matters one is bound and able to know." (Reference: St. Thomas Aquinas Summa I-II. q.76.a.1.ad.3)
The very existence of the Holy Church in the future has been placed at risk. The loss of understanding of even the nature of the Church is widespread, and it is now possible to find wide swaths of both the USA and Europe in which there is no evidence of any religious influence. Along with the disappearance of religious sisters and brothers who once ran Catholic Schools and Catholic Hospitals, the Americas and Western Europe have undergone crises in both health care and education. The results seem to be catastrophic for the religious congregations in severe decline (category 1).
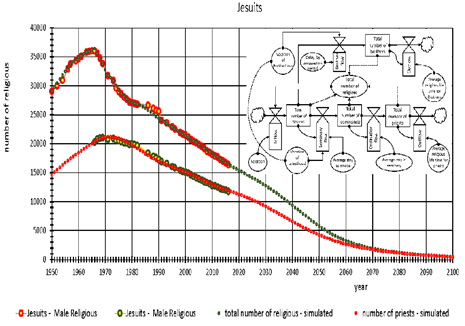
| Figure 25; "By their fruits you will know them" |
|
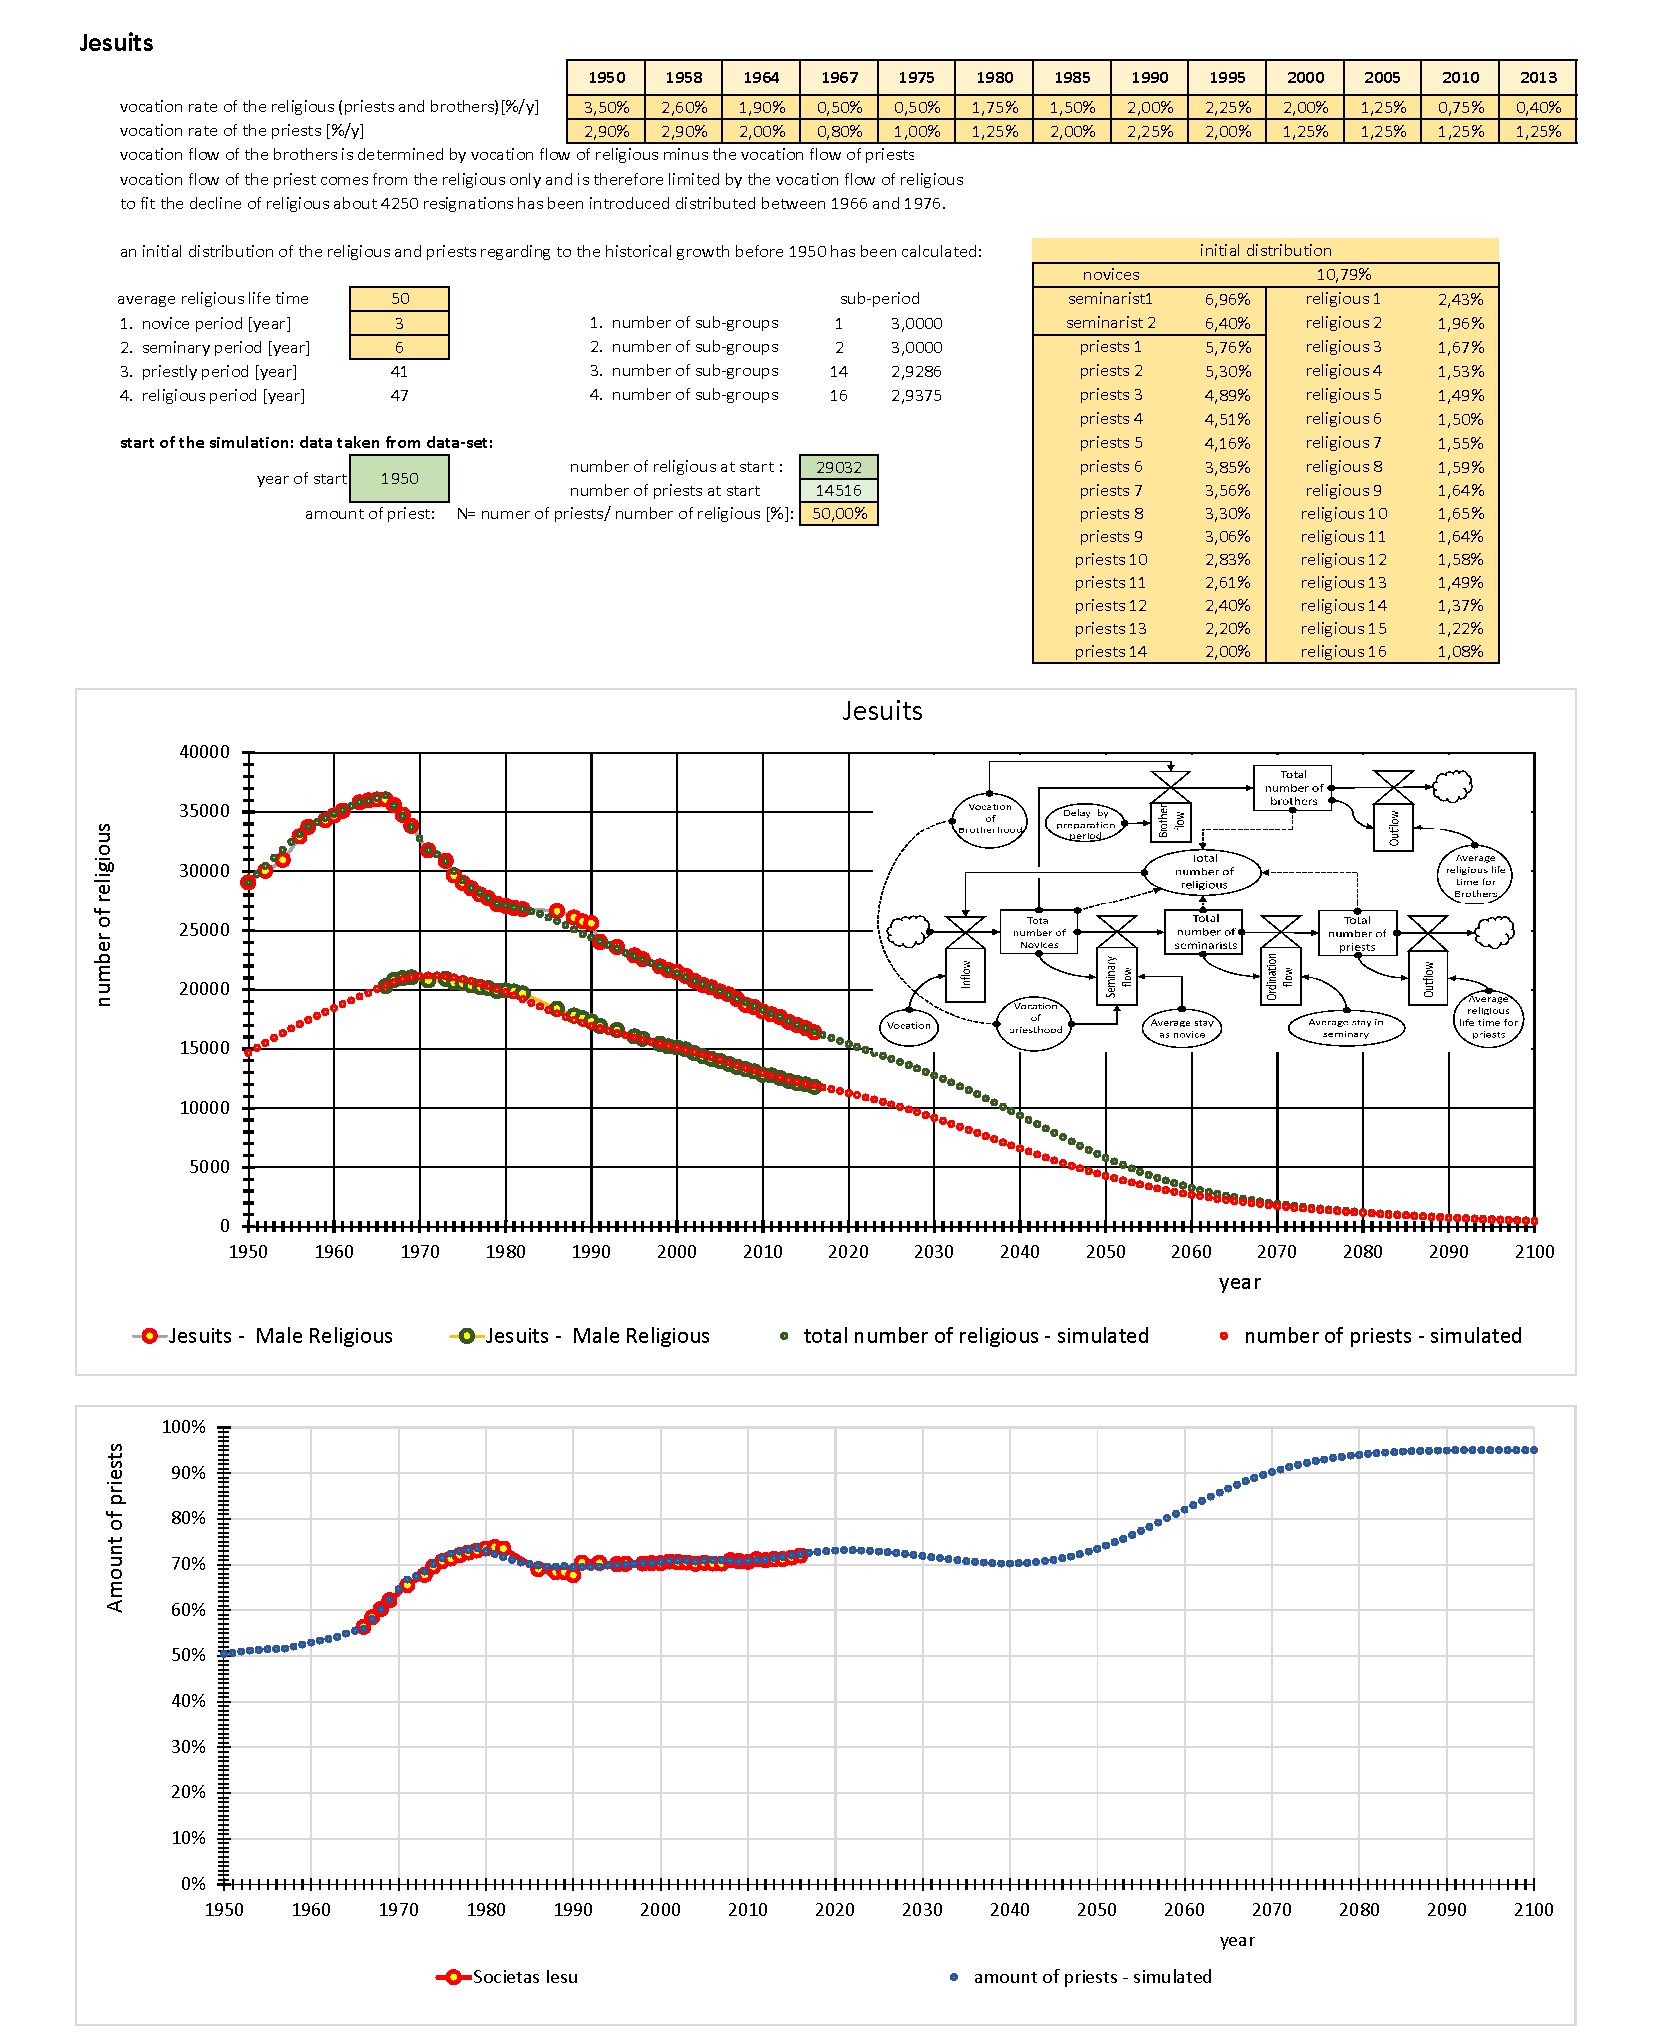
Certainly, one has to realise that a constant declining rate indicates a scenario that gets progressively worse over time. The constant decline of about 300 Jesuits a year reduced their numbers from about 23,000 Jesuits in 1995 to about 16,000 Jesuits in 2015. This is a change from -1.3 %/year to -1.8%/year.
However, based on the fitted data from the past 60 years, more likely is an extrapolation by a 'system-dynamic'-model (Appendix II) taking into account the multiple in- and outflow of the religious Priesthood and Brothers separately, like inflow by vocation of religious and the ordination to Priesthood as well as the outflow by resigning and dying religious. A continuation of the trends of the past 25 years throughout the coming era would see the largest congregation of religious losing its pride and becoming one of the many small groups with less than 2000 members between 2070 and 2080 (Figure 25). Only a return of the Jesuit spirit to that of their founder St. Ignatius can save them from extinction.
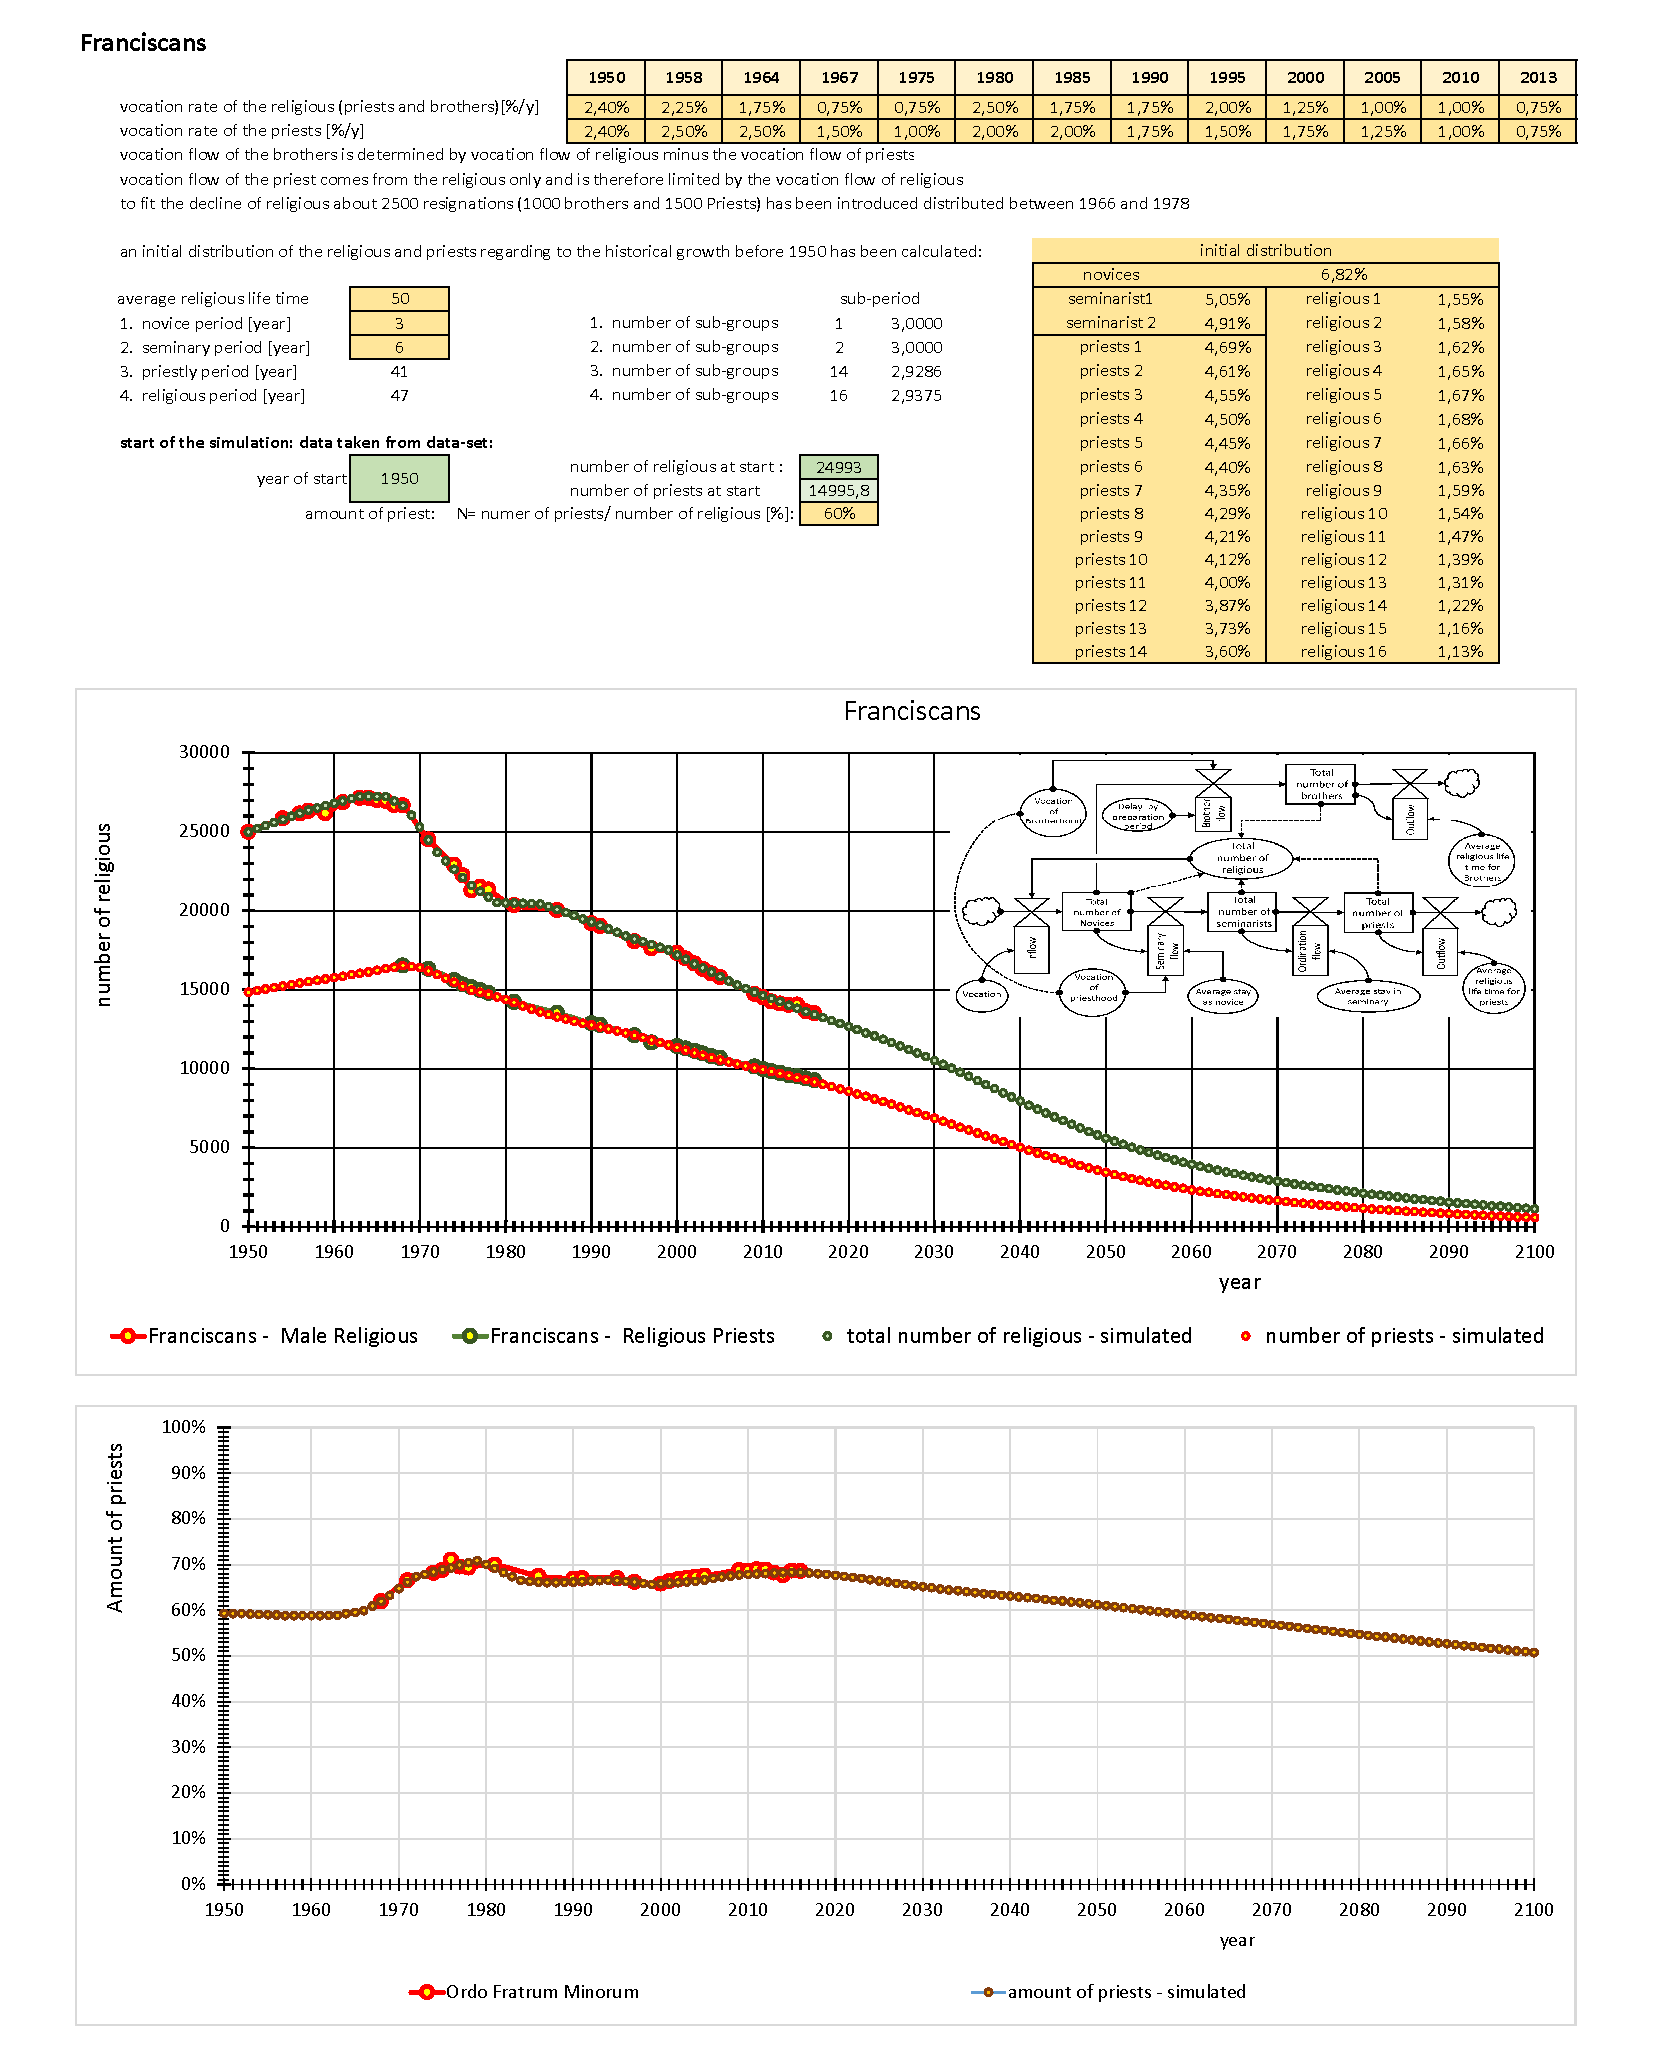
This extrapolation serves as a warning for the future. The stakes are too high to simply ignore the ongoing catastrophe. Therefore, in Appendix II, we provide the results of similar extrapolations for the seven largest congregations. If there is no spiritual conversion among the religious congregations in severe decline, one can expect that the scenarios which these extrapolations predict will certainly eventuate. Not only the Jesuits, but also the Franciscans, Redemptorists, Benedictines and Dominicans will decline into small unimportant religious congregations within a period of 80 years, if no reform takes place.
Considering the magnitude of the loss, one has to wonder: why is there such reluctance among so many of the prelates and Superiors of the Congregations to acknowledge the reason for which the decline began and then to respond accordingly? The ongoing decline does not only pertain to those religious congregations in severe decline; it affects the entire Church and all humanity. The loss of those religious who, for centuries worked in missions worldwide has handicapped the Church. The loss of orders that once ran hospitals and schools has left our inner cities violent and destitute.
The superiors of those congregations that are in continued decline have
a heavy responsibility in this, and will be called to account for it. They can
either continue propagating this ongoing catastrophe or they can begin the
process of recovery by returning to the original spirituality of their founders.
The authors hope that this study will inspire further investigation into the subject. But more importantly, it is our hope that it will inspire action by those responsible for leading the Church into the future. Those institutes which are thriving should be held up as models to be emulated. Those which are slowly dying and show no signs of recovery should be corrected on points of doctrine and liturgy, and if they refuse to conform they should be suppressed. The stakes are too high to simply ignore the devastation of the vineyard.
A summary of this report has been published
here on 1P5 and
here on Christendom Restoration Society
This report can be download as pdf-file here.
send an Email
List of Figures
Figure 1: Male religious 1978 - 2000 (EWTN [4]) and 2001 - 2014 (Agenzia Fides [3])
Figure 2: Overview of ordinations and resignations after the restoration of the Hierarchy in The Netherland in 1853 (last update 2014).
Figure 3: Overview of priests active in the Dutch dioceses since 1900 comparing with an extrapolation based on the number of ordinations till 2050 (last updated data 2014 � last updated extrapolation 2012)
Figure 4: Overview of the Dutch population: total and Roman Catholic from 1850 to the present time as well as the Mass attendance from 1958 (last update 2014).
Figure 5: Overview of faithful per diocese priest active in the Dutch diocese since 1950 comparing with the number of faithful attending Mass per priest (last updated 2014).
Figure 6: Timelines of 67 Institutes of Consecrated Life
Figure 7: Reconstruction of the timeline of all religious
Figure 8: Comparison data concerning the Jesuits [1], [20]
Figure 9: Comparison data concerning the Salesians of Don Bosco [1], [21]
Figure 10: Timelines of the seven largest Institutes of Consecrated Life [1]
Figure 11 Institutes in Severe Decline
Figure 12: Institutes in Severe and Extreme Decline
Figure 13: Institutes in Decline but Eventually Finding Stability
Figure 14: Institutes in Decline but Eventually Reaching Slow Rate of Growth
Figure 15: Institutes Eventually Restoring Pre-1965 Membership Level
Figure 18: Institutes founded after 1966
Figure 19: Number of clergy in USA [6]
Figure 20: Number of clergy in England and Wales []
Figure 21: Number of faithful per priest in USA
Figure 22: Religious Sisters in US (1943-2012) [20]
Figure 23: World population and baptized Catholics [3]
Figure 24: Compensation of Jesuits' decline
Figure 25; "By their fruits you will know them" (Matt. 7, 15-16)
References
[I] Emeritus Assistant Professor on Soil Mechanics and Foundation Engineering, Delft University of Technology
. . . Acting President of the International Federation Una Voce (2006-2007)
. . . Vice President of the International Federation Una Voce (2005-2006, 2007-2013, 2017-....)
[II] Associate Professor of Computer Science and Director of International Studies Program, Lyon College
[1] 'The Hierarchy of the Catholic
Church', statistical data per institute, http://www.catholic-hierarchy.org/;
[2] 'Anuario Pontificio', issues
1960, 1961, 1962, 1965, 1966 and 1969; Tipografia Poliglotta Vaticanum.
[3] 'Agenzia
Fides'. http://www.fides.org/en/stats#.WEBYCa-V419;
[4] 'Annuarium
Statisticum Ecclesiae', Published for 2000
L'Osservatore Romano provided by EWTN [http://
www.ewtn.com/library/CHISTORY/ANNU2000.HTM];
[5] GCatholic.org (formerly
Giga-Catholic Information) http://www.gcatholic.org/about.htm;
[6] 'CARA, Center
for Applied Research in the Apostolate'. http://cara.georgetown.edu/frequently-request ed-church-statistics/;
[7] 'Index of Leading Catholic
Indicators: The Church Since Vatican II', Kenneth C. Jones (2003), Oriens
Publishing Company, St. Louis, Missouri, ISBN 10: 0972868801.
[8] 'Prospectives for Growth: A
System Dynamics Study of the Roman Catholic Priest Population of the Netherlands',
Oostveen J.P. and Sweeney D.J. (1986), International Conference of the System
Dynamics Society, Seville, Spain, p1183;
[9] 'Statistical evaluation of the
Roman Catholic Church in the Netherlands', Oostveen. J.P., http://www.ecclesia
dei.nl/rkstat/index.html (1997);
[10] 'Springtime
Decay', www.seattlecatholic.com
(2004);
[11] 'Ecclesiastical Aggiorniamento
and Exponential Decay Functions: A Statistical Analysis', Albert P. Marcello
III, Fourth Annual Faculty-Student International Conference in Honolulu,
Hawaii. May 26-31 2004.
[12] 'The Priest Shortage: A
Manufactured Crisis?', www.christendomrestoration.org
(2015);
[13] 'La v�rit� des
chiffres � les religieux en France', http://www.servianet.com/laveritedeschiffres/eglise/ religieux.pdf (2016);
[14] 'Irish Priestly Vocations in
Worrying Decline', Catholic World Report (2012);
[15] 'US Catholics Face Shortage of
Priests', Dave Breitenstein (2014), USA TODAY;
[16]
'The Catholic Church's priest shortage
crisis: a self-inflicted wound', https://www.life-sitenews.com/ blogs/the-catholic-churchs-priest-shortage-crisis-a-self-inflicted-wound.html (2015);
[17] 'Risk analysis of Vatican II',
Oostveen. J.P. http://www.ecclesiadei.nl/docs/risk_analysis.html
(2016);
[18] 'The changing demographics of
Roman Catholics', Saenz (2005), Rogelio Population Reference Bureau,
Washington DC;
[19] 'Catholic India Running out of
Would-Be Priests', Shaikh Azizur Rahman (2009), The National;
[20] http://nineteensixty-four.blogspot.nl/2011/02/changing-jesuit-geography.html;
;
[21] http://statisticsal.net/;
[22] http://www.salvatorians.com/about.html;
[23] http://congregationofmercy.org/apostolate.html;
[24] http://www.svdmissions.org/;
Appendix I
Overview on Religious Congregations
Overview on Religious Congregations
|
Appendix II
Simulation/Extrapolation
Simulation/Extrapolation
General
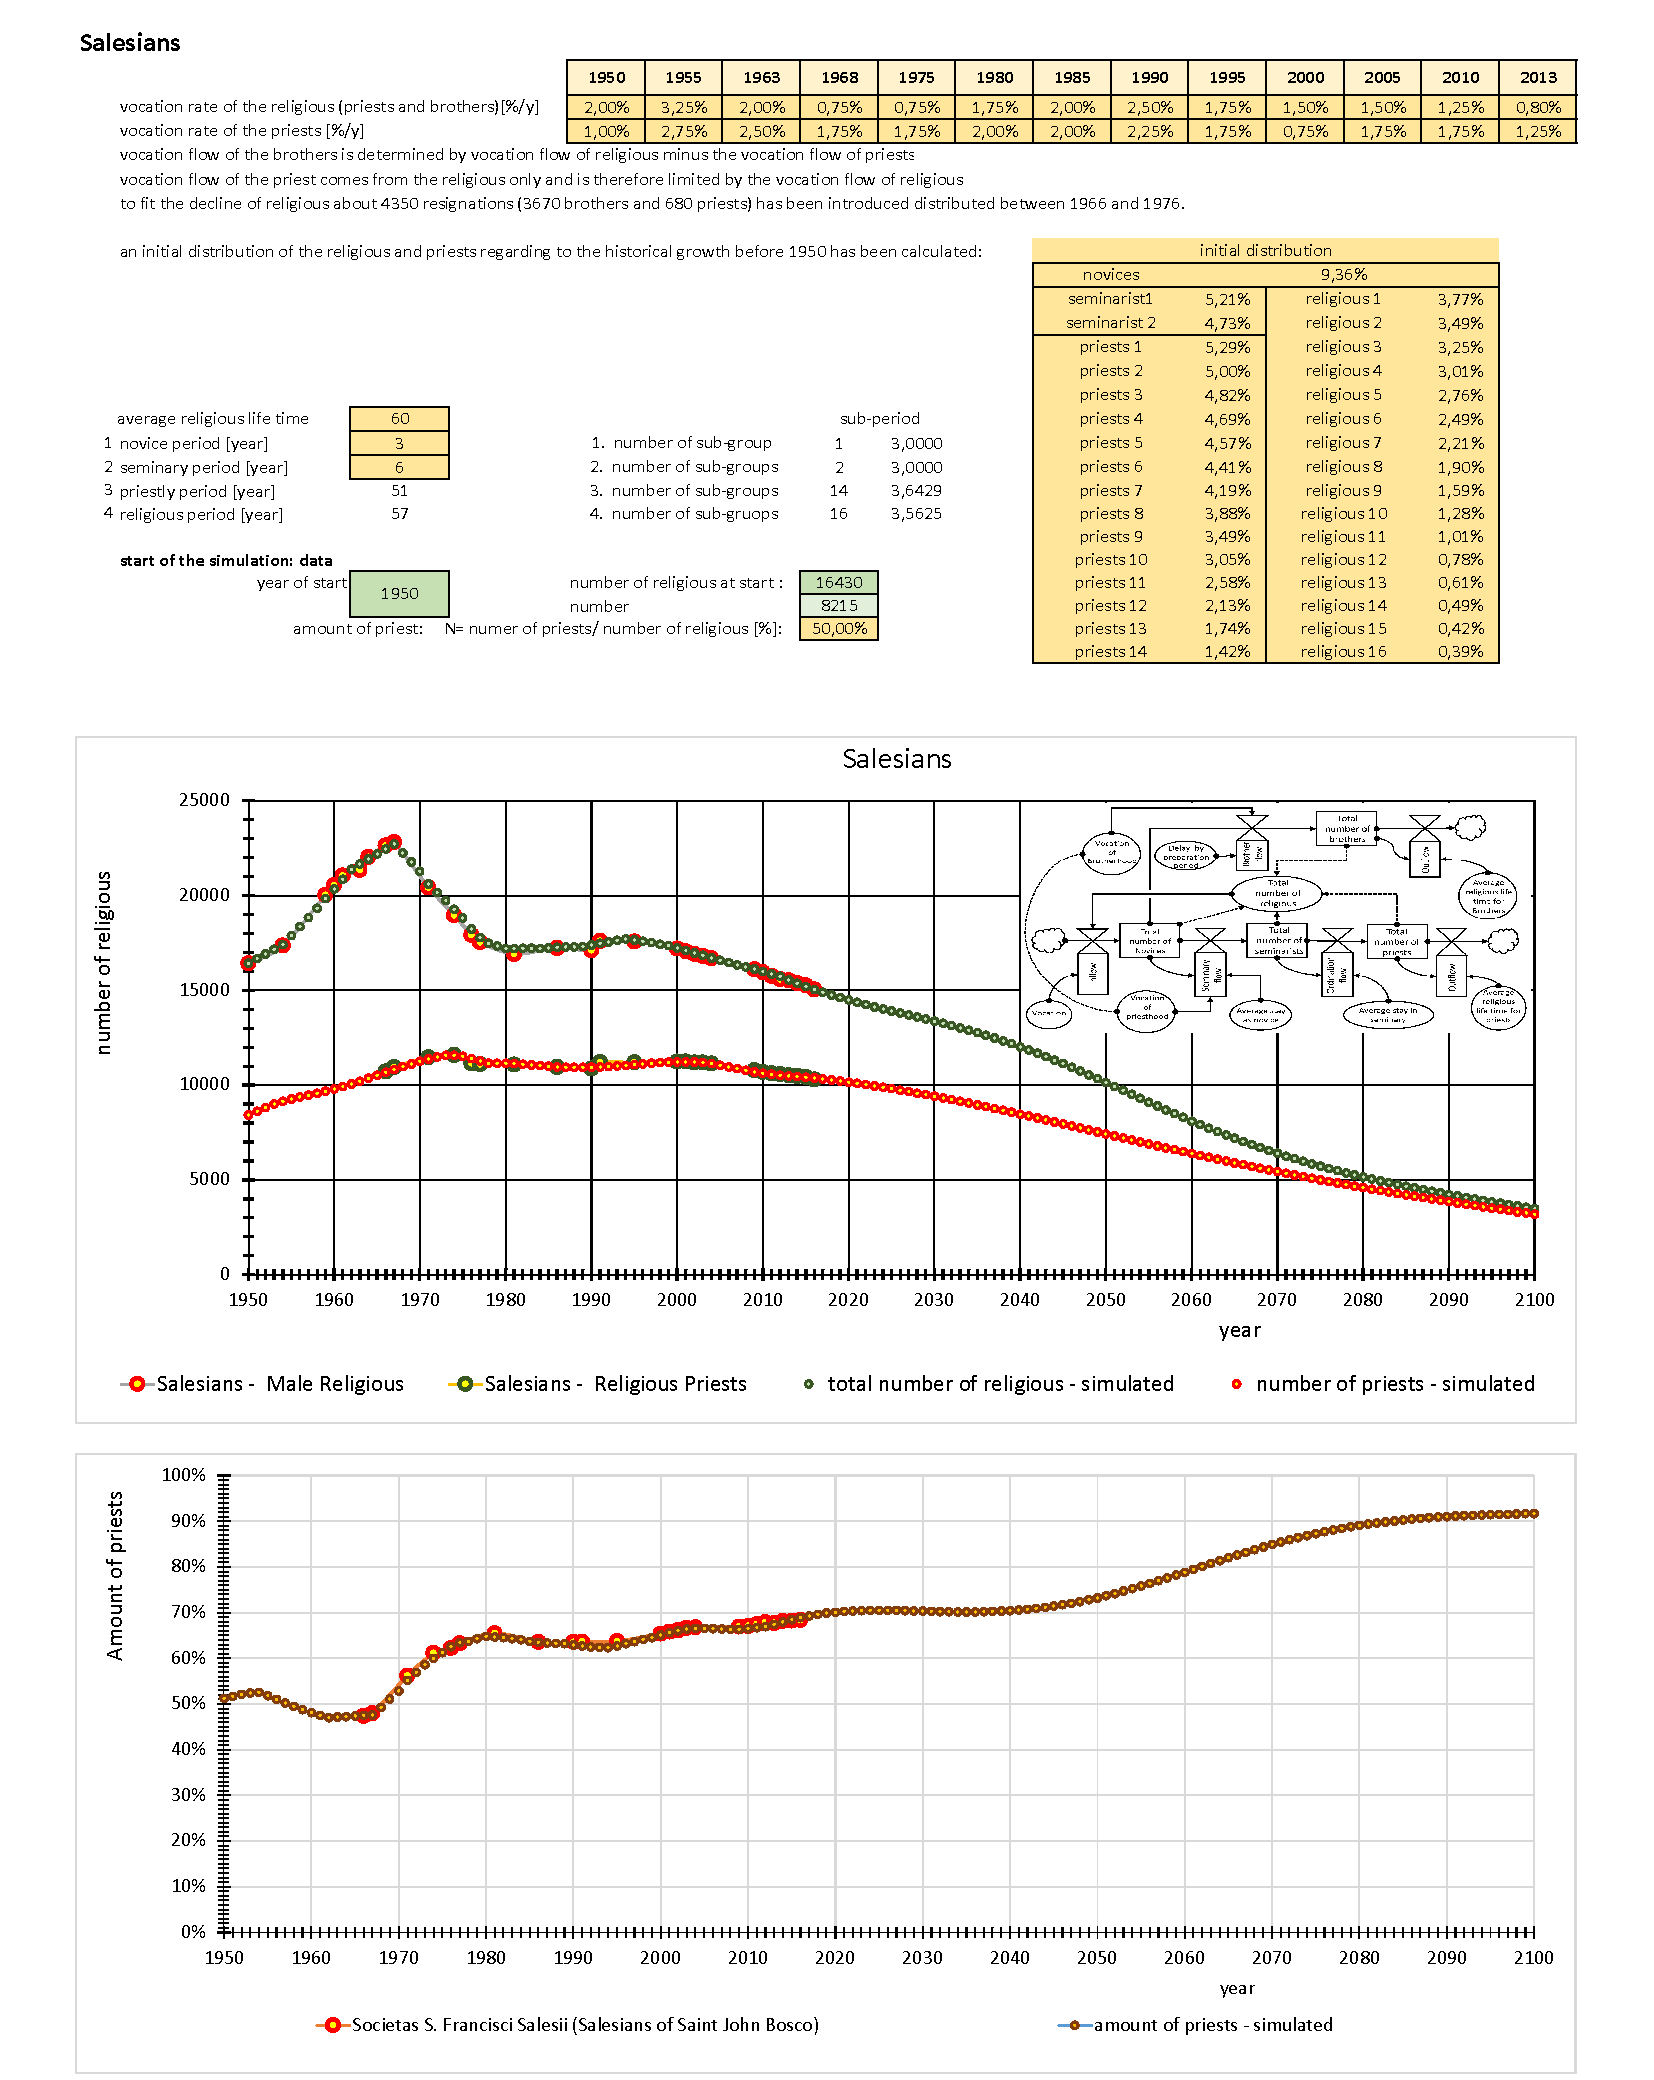
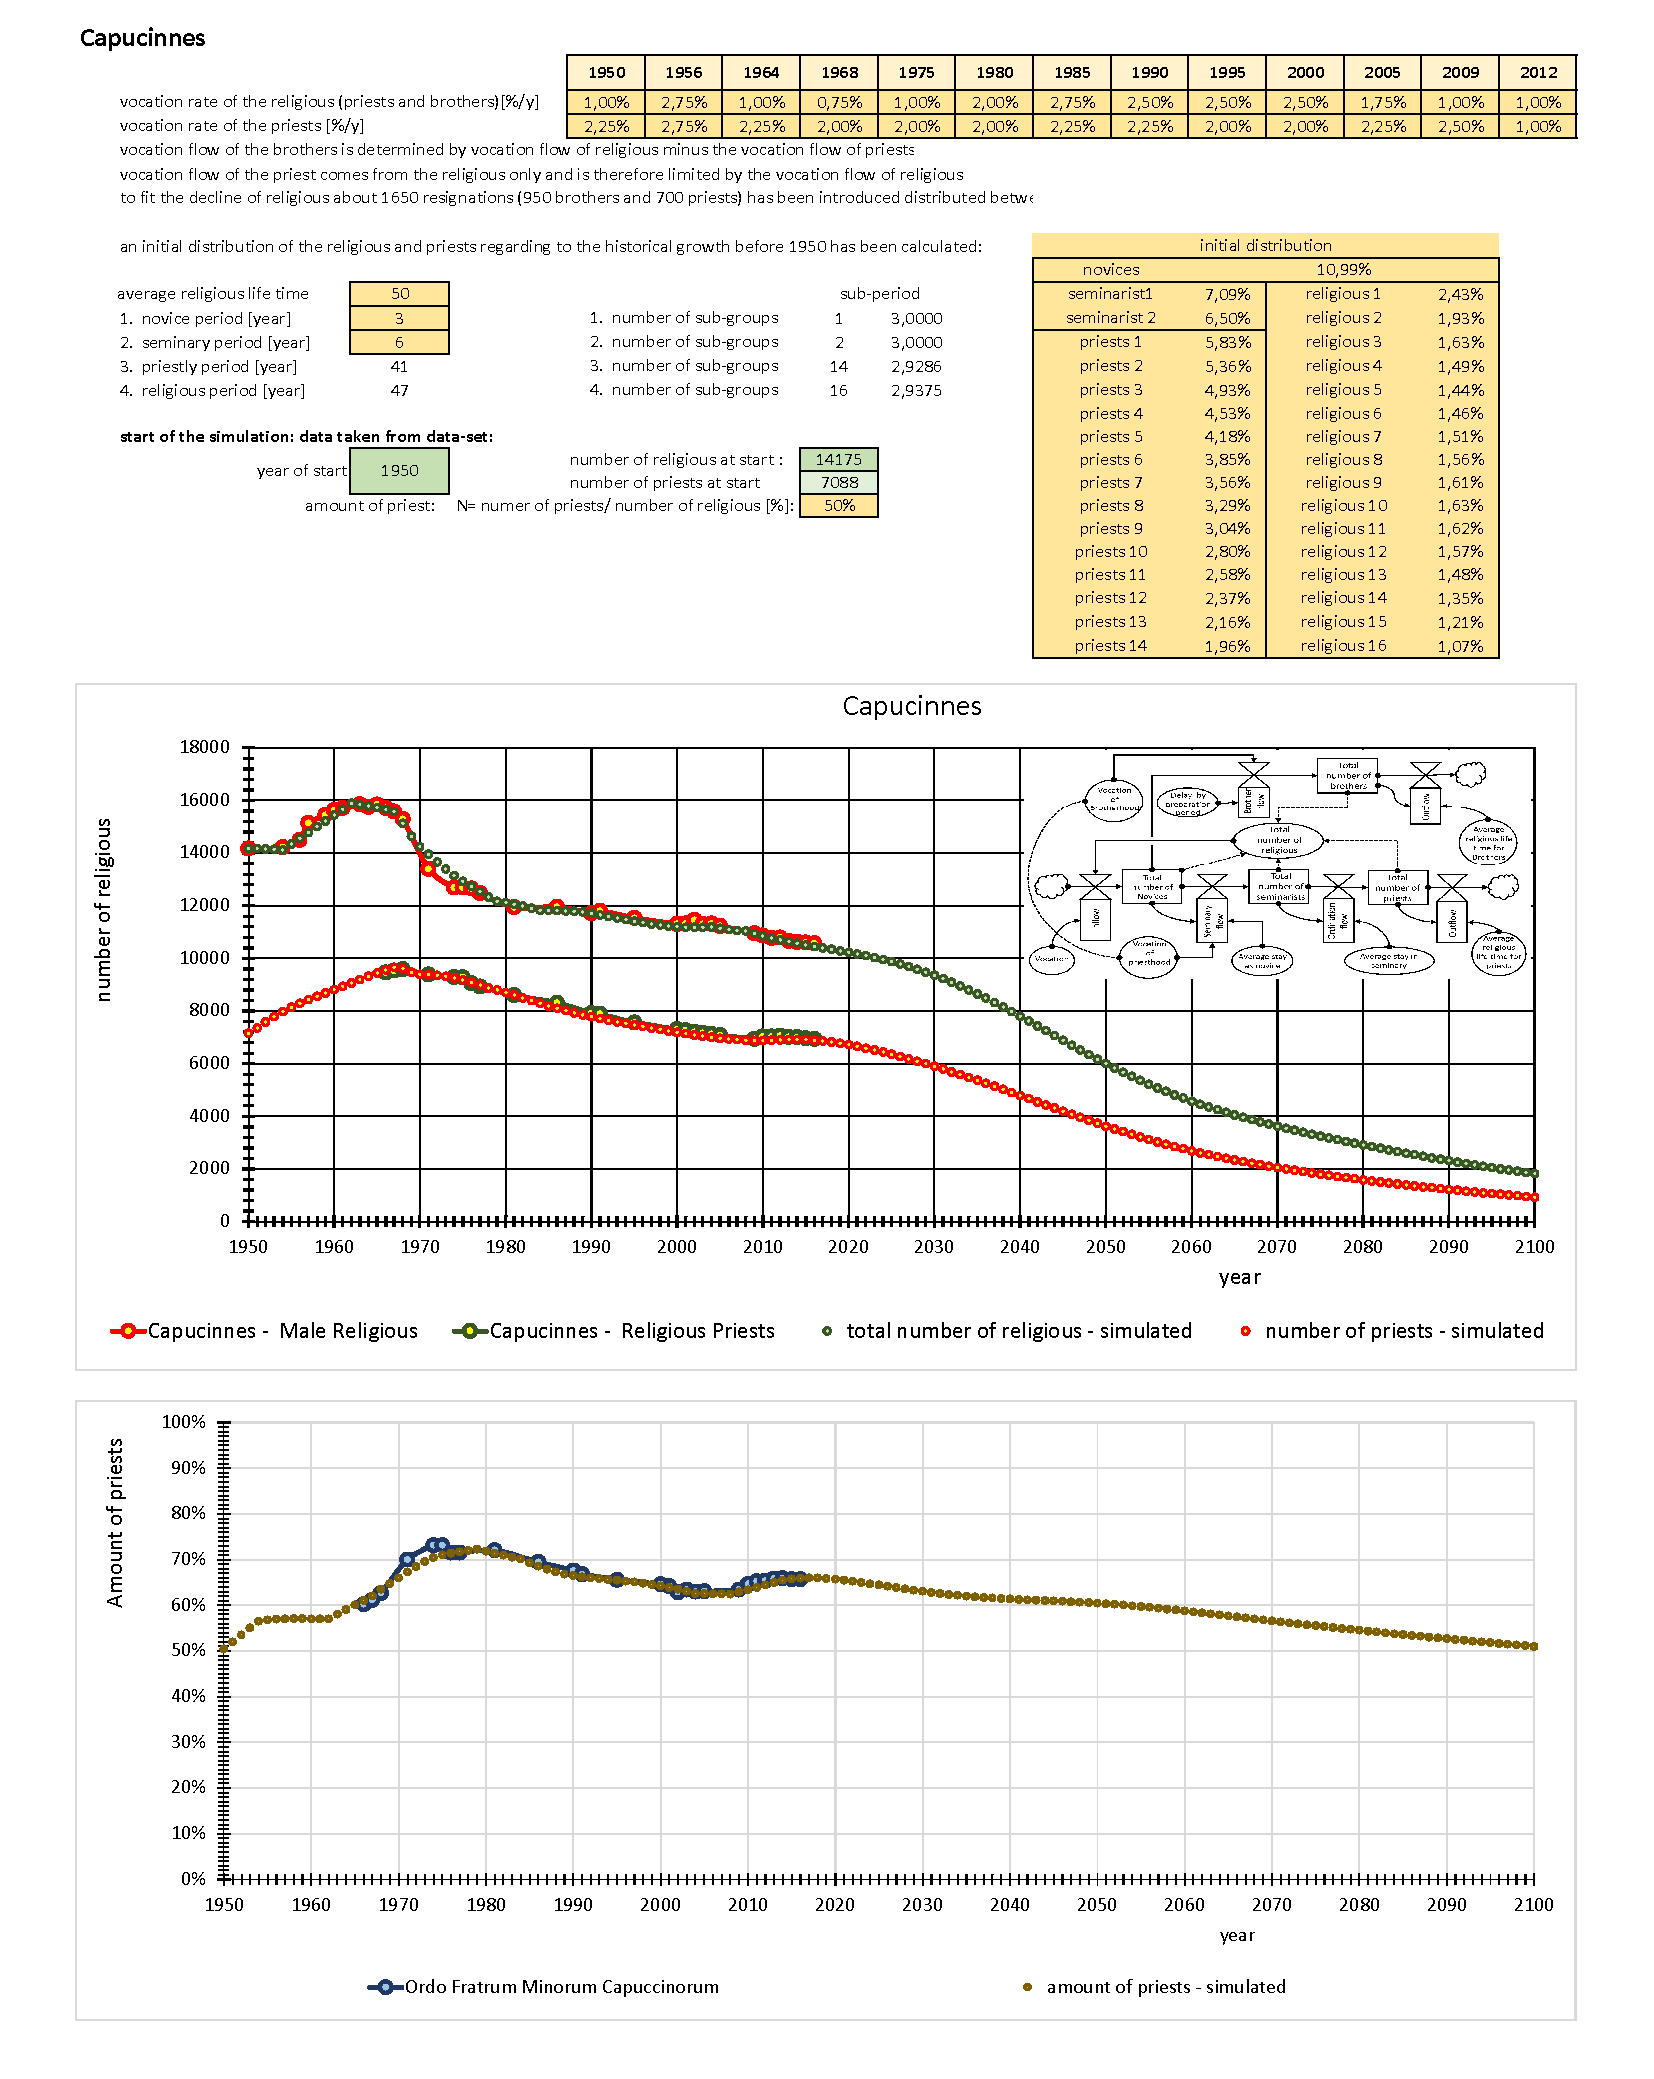
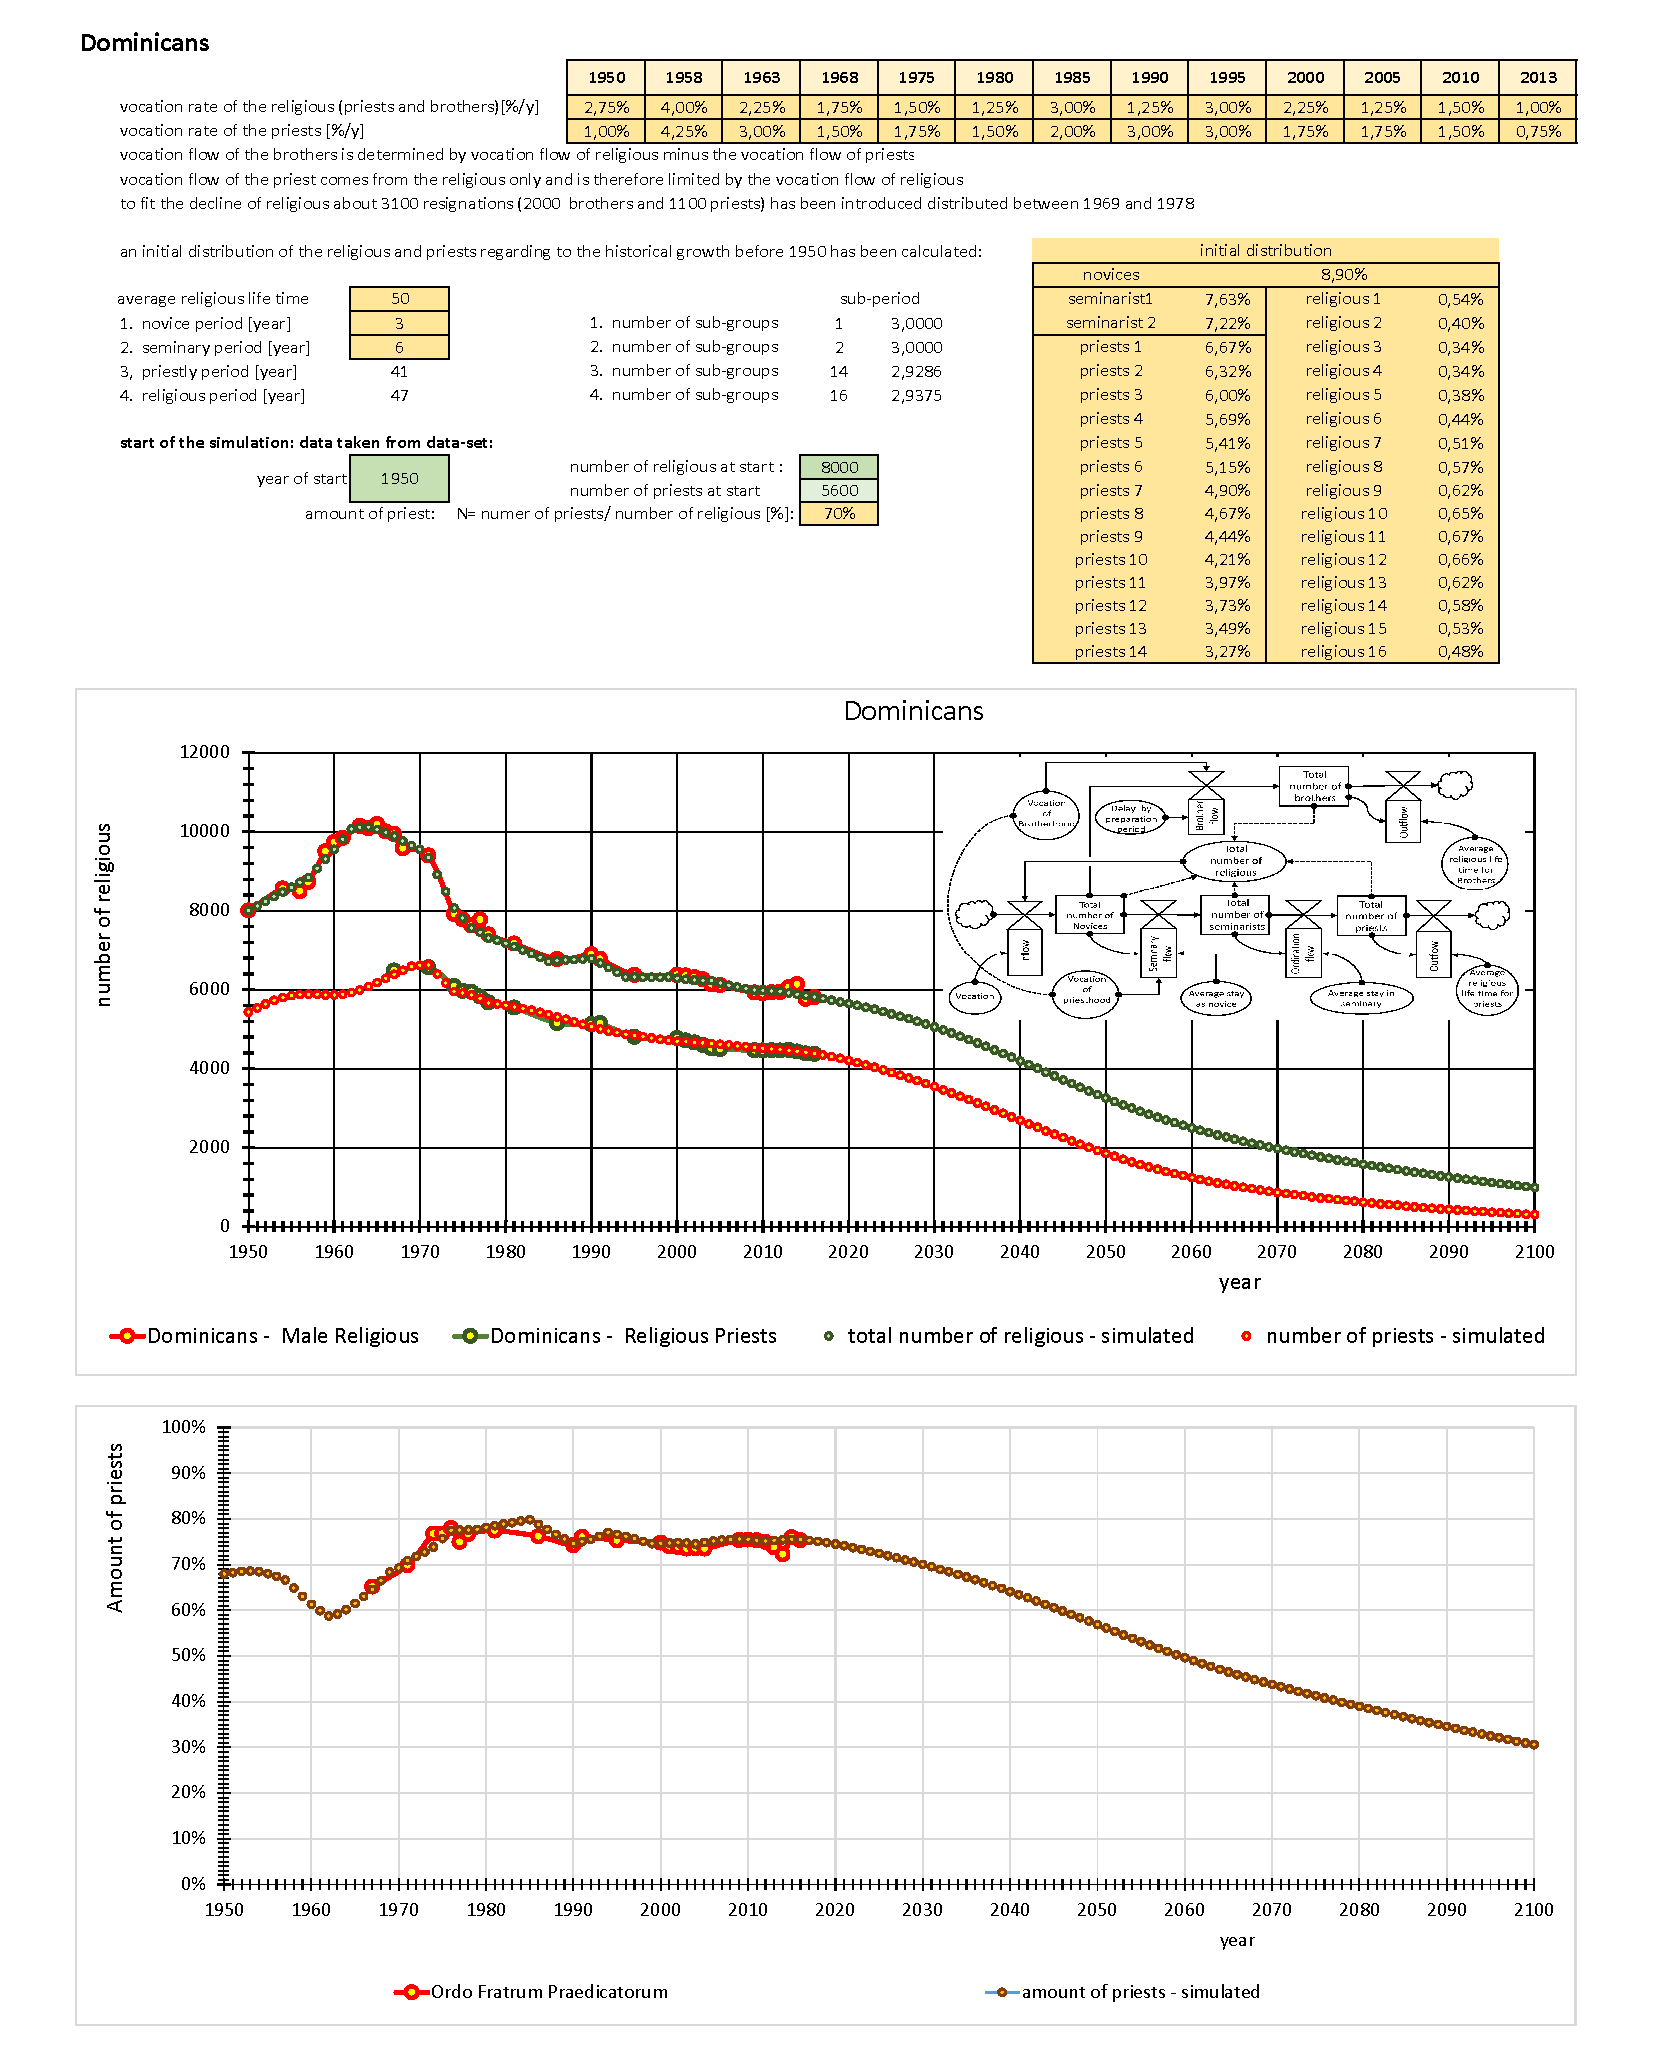
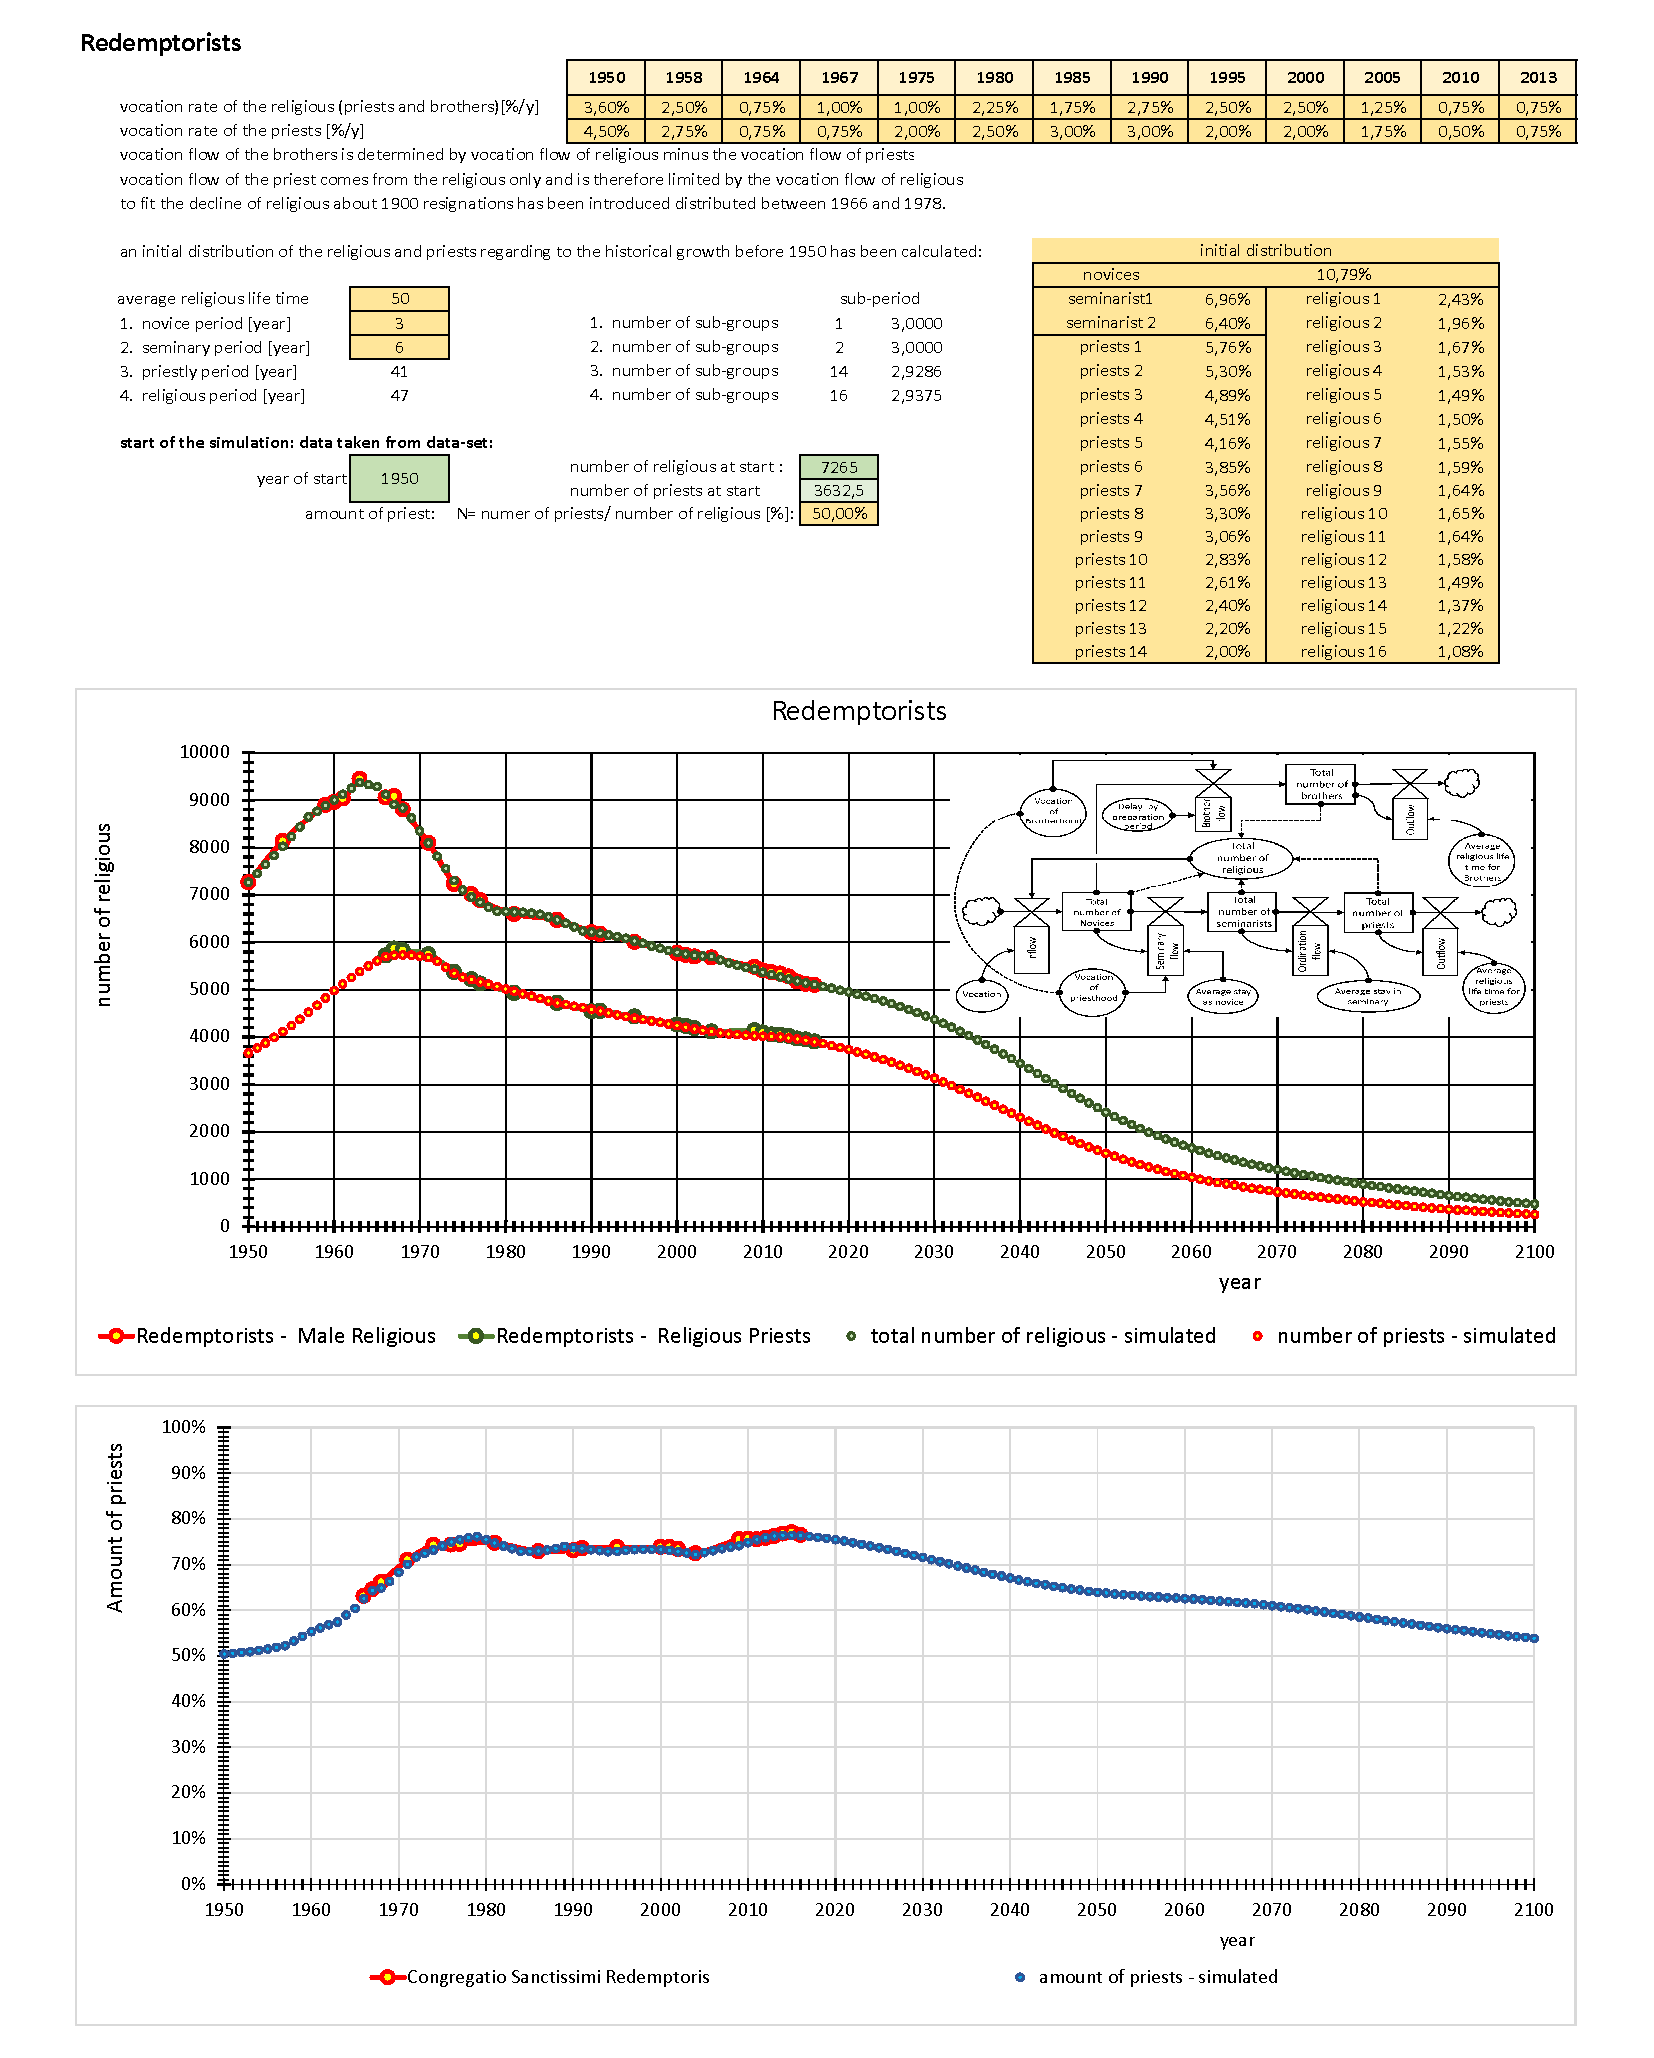
The following graphics concern first trial-simulations of the 7 largest congregations, all marking a Severe Decline since Vatican II. These simulations are based on a dynamic flow-model and data-sets available. However they have to be considered as a first trial yet because not all necessary initial input-data were available by the internet, like the initial distribution over the several sub-periods of religious and priestly life, the average religious lifetime, etc. Though that thereto rough estimations had to be made, these graphics show the general trend what will happen if the last (post-council) period will continue for a longer term after today.
The dynamic flow model in use here is using averages data of large groups and therefore cannot used for small groups, where small changes caused relative large effects that cannot be neglected. This model gives global insight regarding to the trends of the processes and cannot consider as exact prognoses. Of course the results are still depended on the quality of the model as well as the data used.
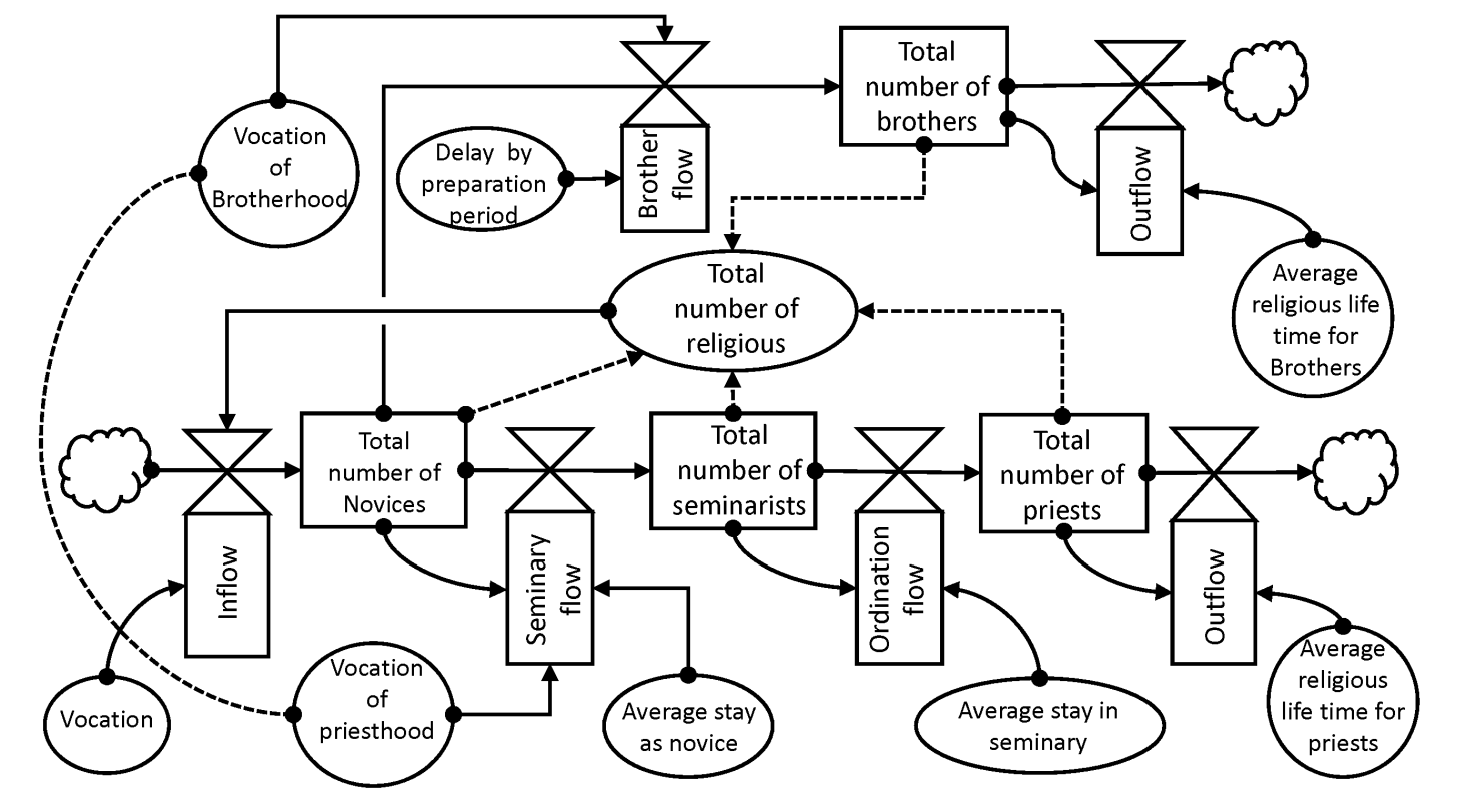
Flow model
The dynamic model exists by a vocation-inflow feeding two flows. A first flow concerns the seminarians-priests line and the second flow is the brothers-line. Both these flows can parallel be distinguished by a chain of 16 sub-(age-) groups. Note that all religious not being ordained concern the Brotherhood, thus also the seminarians that take part of the seminarians-priests line. Hereby the flows are determined by so-called residence-time for each stage in which the religious are. While the ultimate total residence time is determined by the average religious life time from vocation to death, this has been divided by a number of logical stages according the two flow lines. In this case the average religious life-time has been suggested about 50 years which is divided into sub-stages with a residence time of about 3 years. Then the outflow of each stage can be determined by dividing the number of religious by the residence time of that stage, while this outflow is the inflow of the next stage. Due to this method the average religious age grouping can be simulated. Here the inflow of the first stage is determined by the number of average vocations and the outflow of the last stage is the average number of death of the religious. Of course some are dying earlier and others later, but this simulation is based on the averages values.
For this first trial simulation the chosen average residence time of the sub-stages are founded on the suggestion that the average novice and seminarian period is about 9 years, where the average moment of the choice for the priesthood and brotherhood has been set at about 3 years, at which the flow line of the brotherhood started parallel to the flow-line of the seminarian-priest.
By taking into account the average religious age grouping the distribution of these age grouping over the total group of religious at the start of the simulation in 1950 is important too. This has been constructed by a separate simulation.
The inflow by religious vocation is expressed in percentages regarding the number of religious as an indication of the average religious 'fertility' of all religious involved. This inflow has been used as fitting parameter to fit the number of religious. This is also for the inflow of the seminarian-priest flow line, whereas the inflow has been taken from the religious inflow as expressed in percentages of the number of priests. This inflow with a limit determined by the outflow of the first stage of three years whereby the inflow for the brother flow-line is zero, has also been used as fitting parameter to fit the time-line curve for priests. While generally the outflow of religious by resignation is negligible regarding the use of average values, this was not the case between 1963 and 1976. Evidently the time-lines of both, the total religious and the priests cannot be fit without taken into the resignations. However, whereas the available databases do not provide any information about the resignations, the data used has to be seen together with the other input parameters.
The extrapolation of the simulation is founded on the fitting parameters of the last period of the known time-lines.
|
|
|
|
|
|
|
|
|
|
|
|
|
|
|
|
|
|
|
|

|
|
|
|
|
|
|